
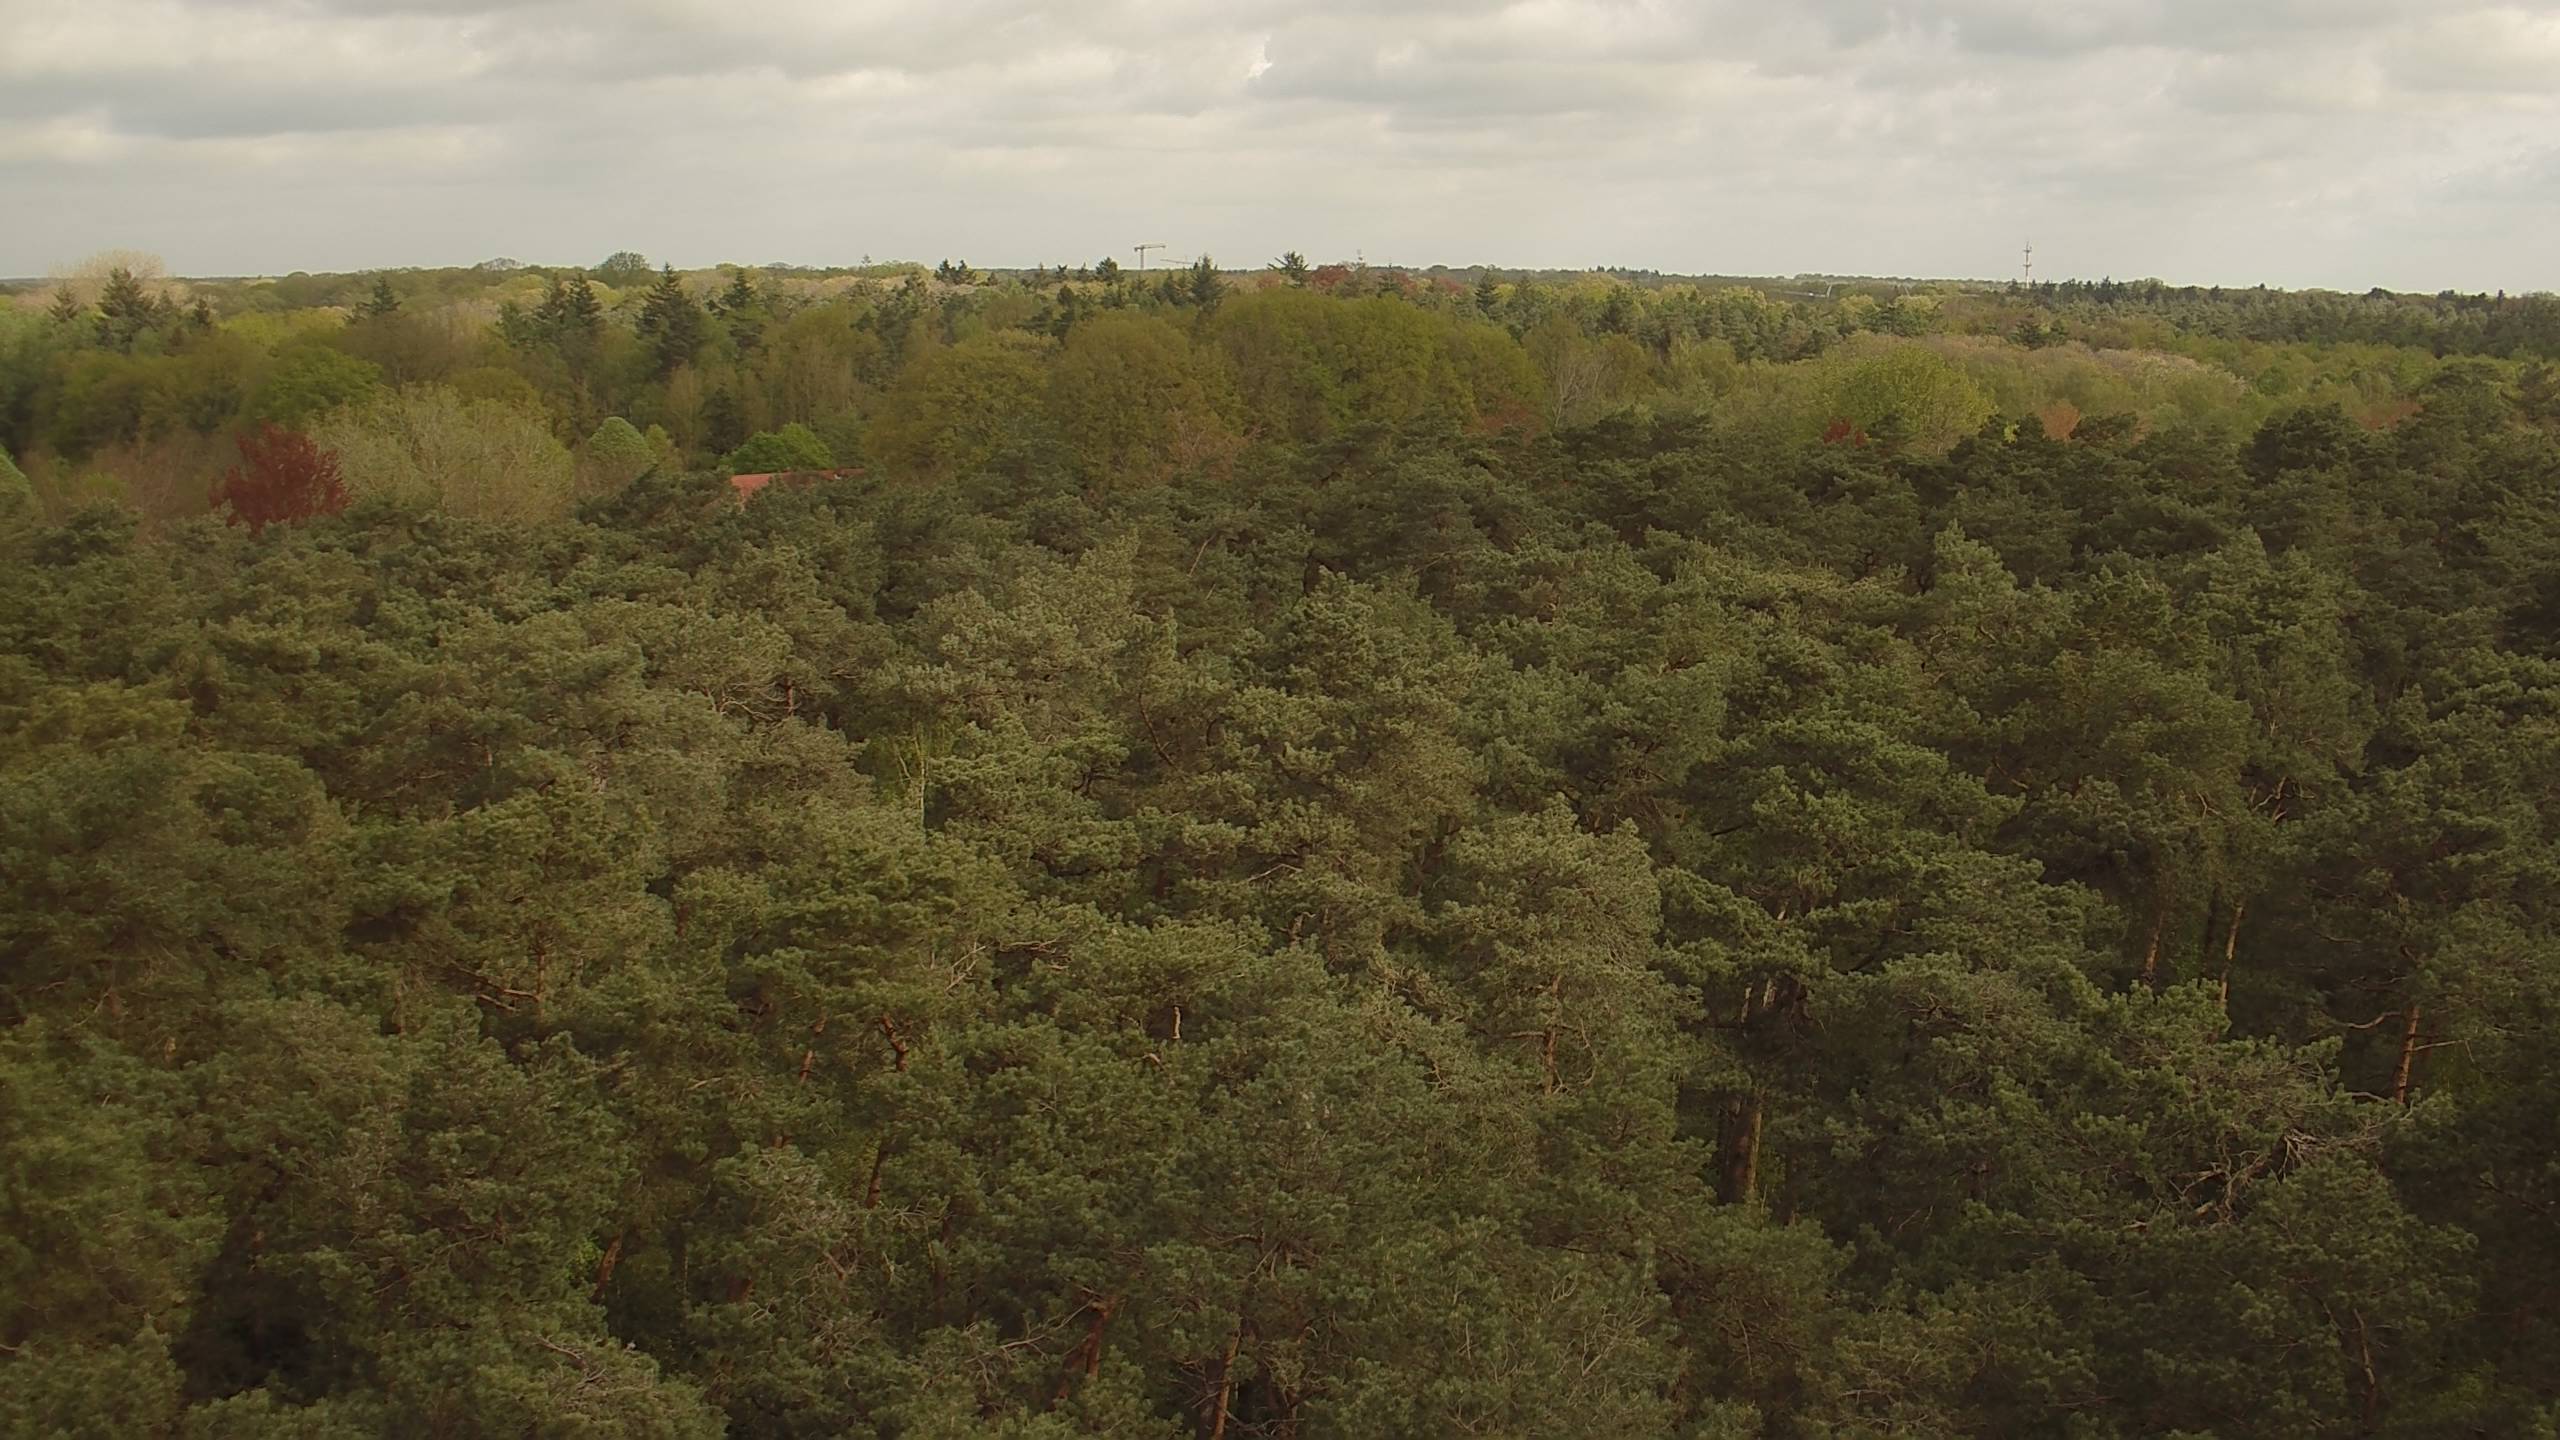
Brasschaat
The ES in Brasschaat is located at ‘De Inslag’ forest, located 10 km northeast of Antwerp. It is a 165 ha mixed coniferous/deciduous forest dominated by Scots pine. The ICOS ecosystem station is located in a study area consisting of a 2 ha, even-aged Scots pine stand (Pinus sylvestris L.).
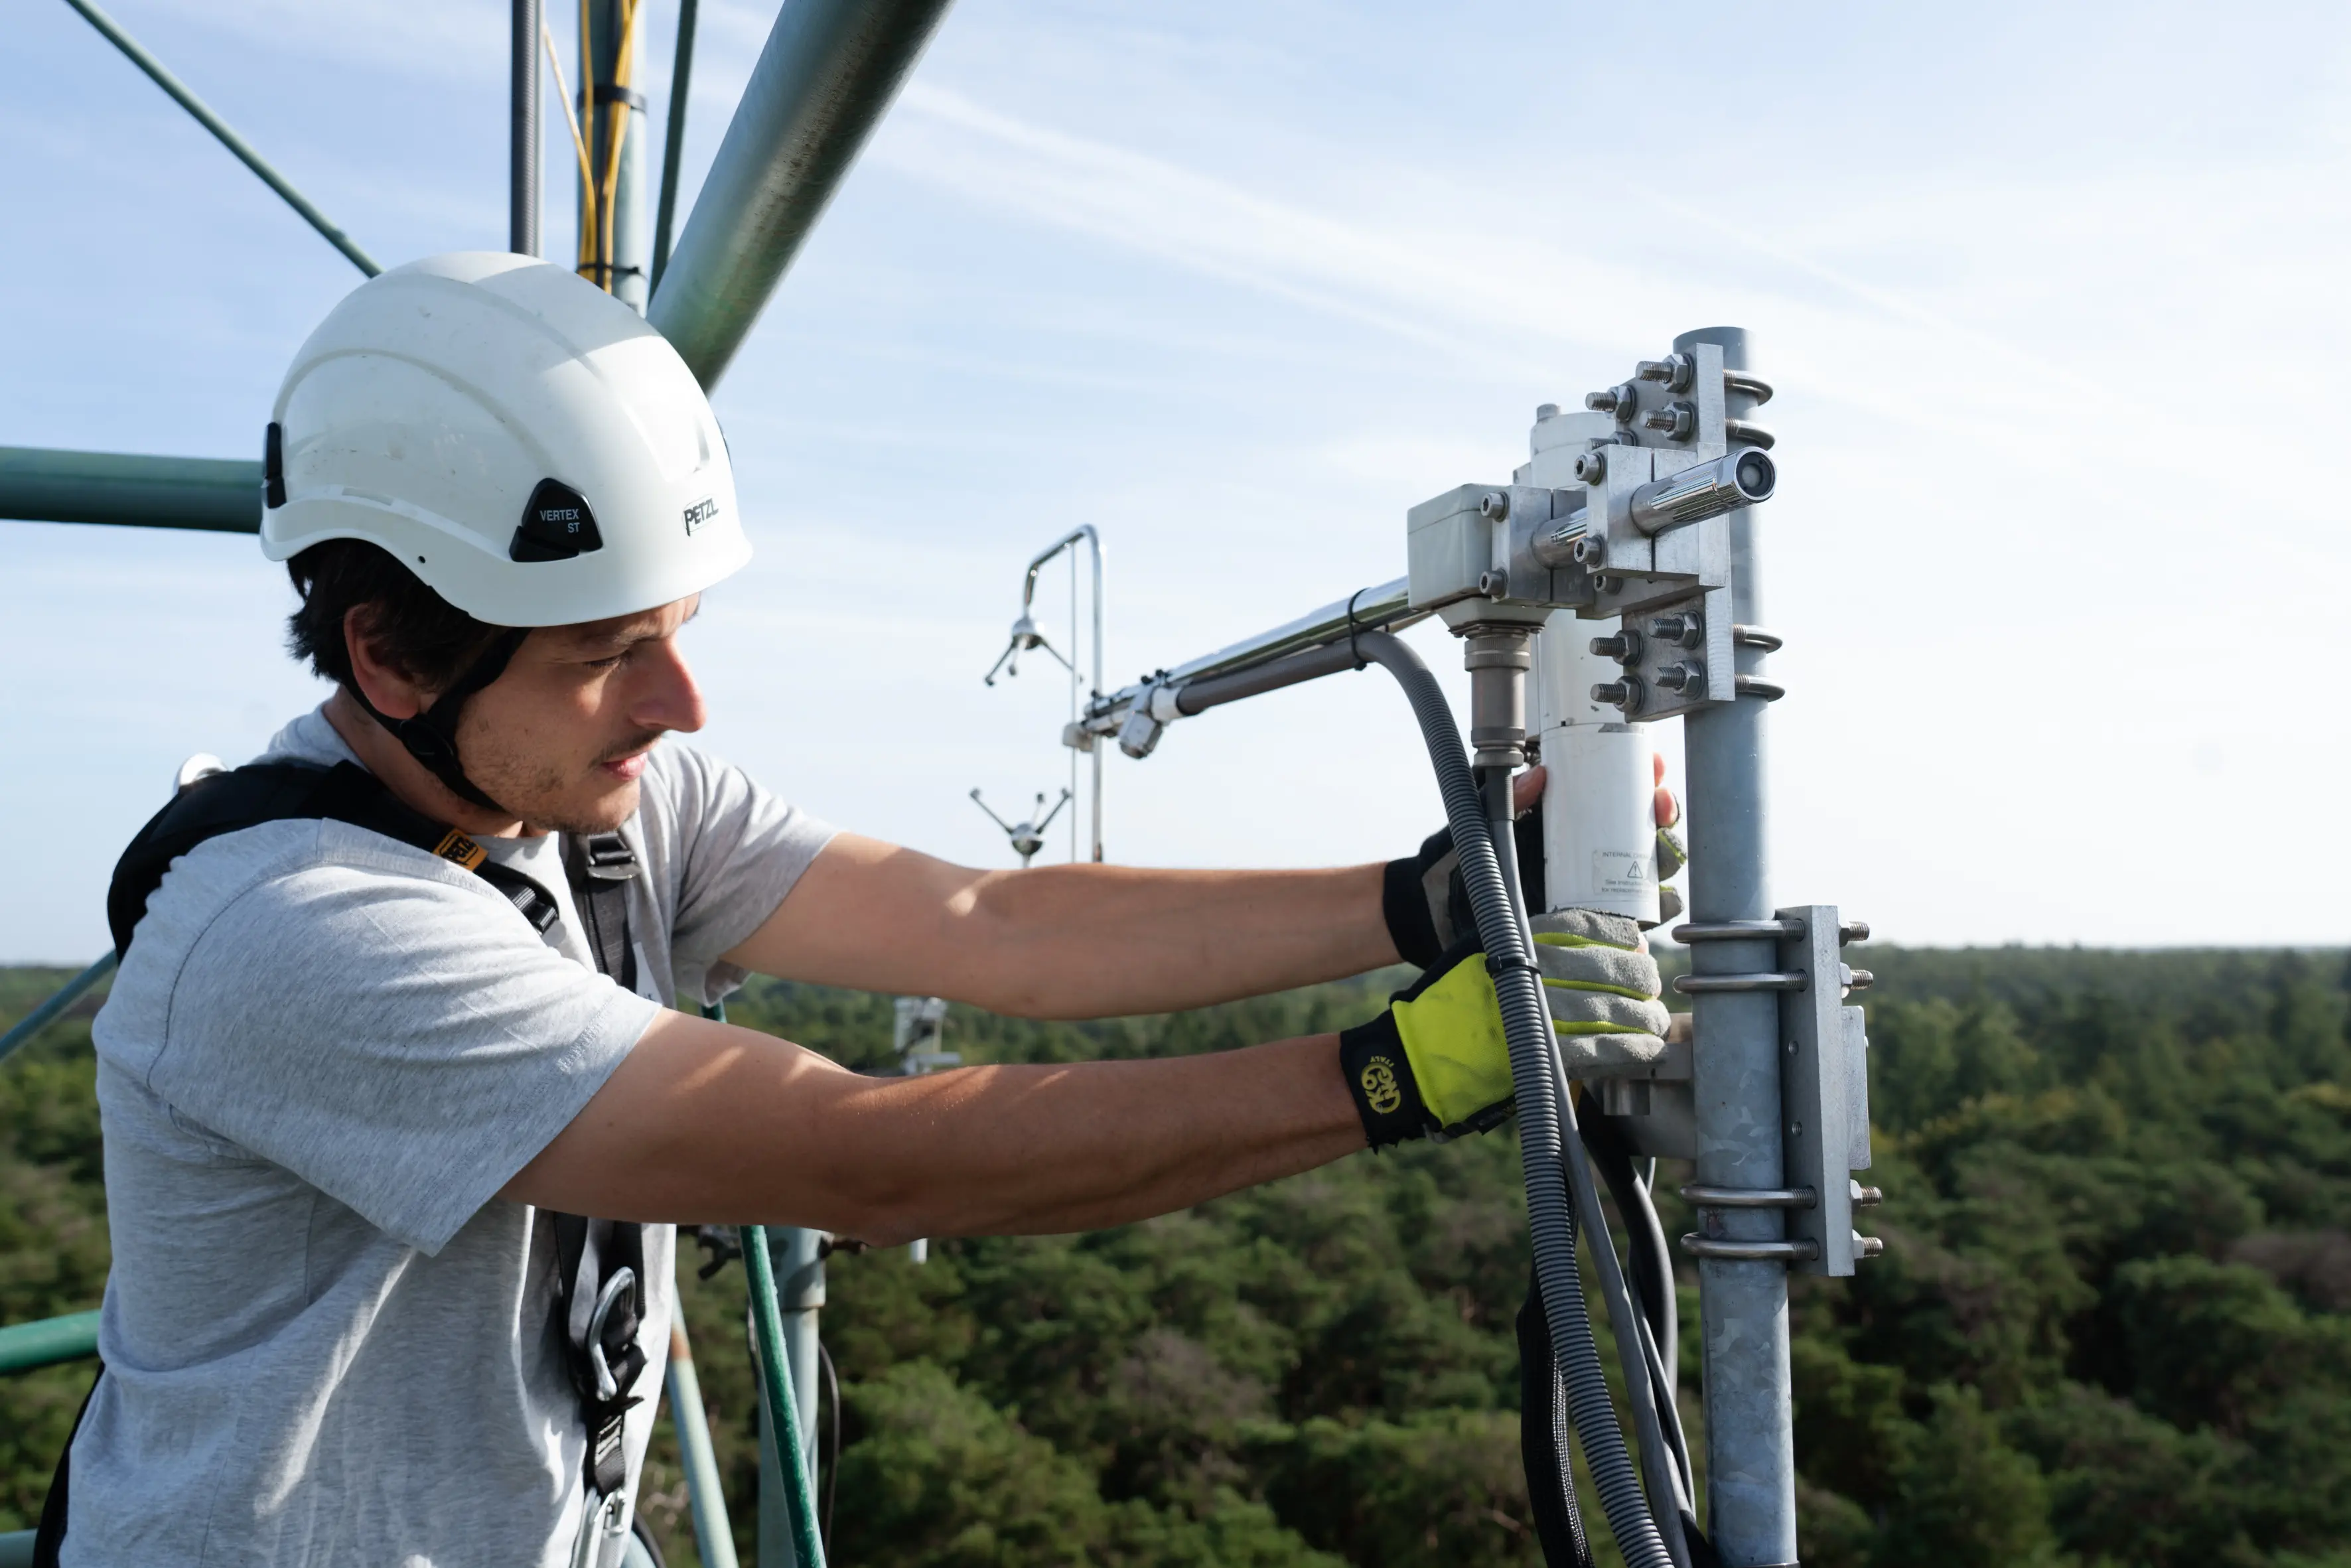
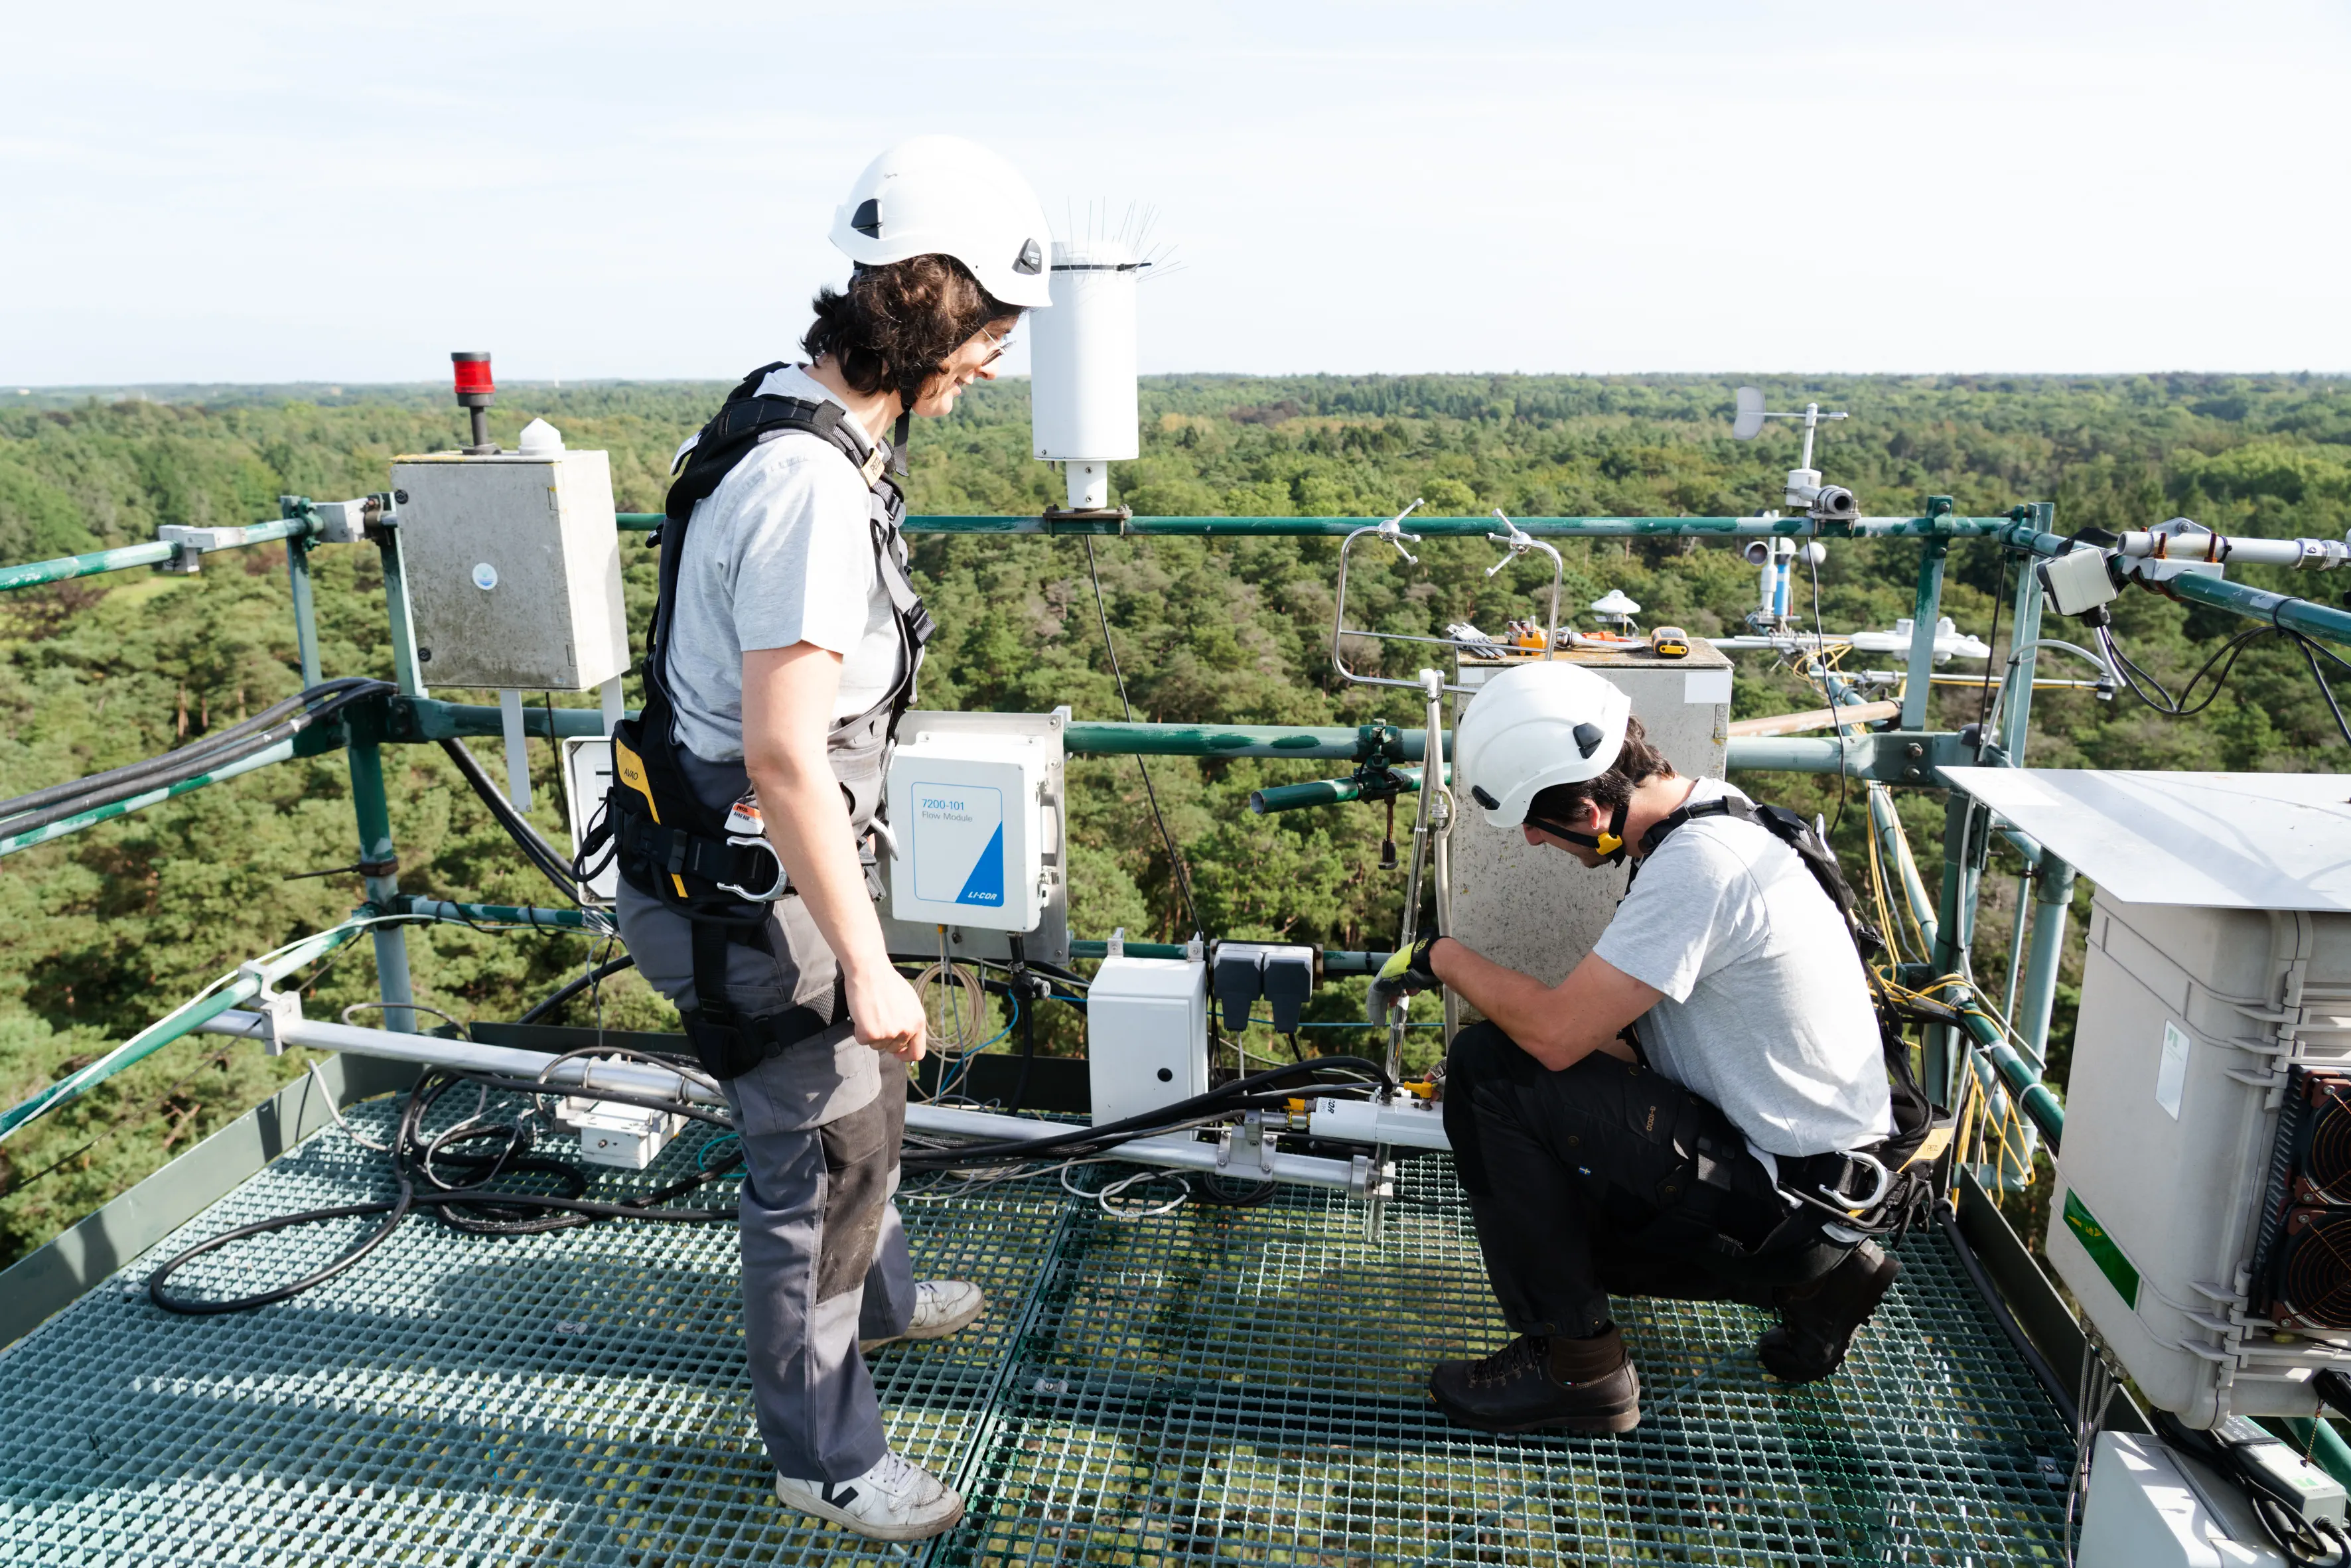
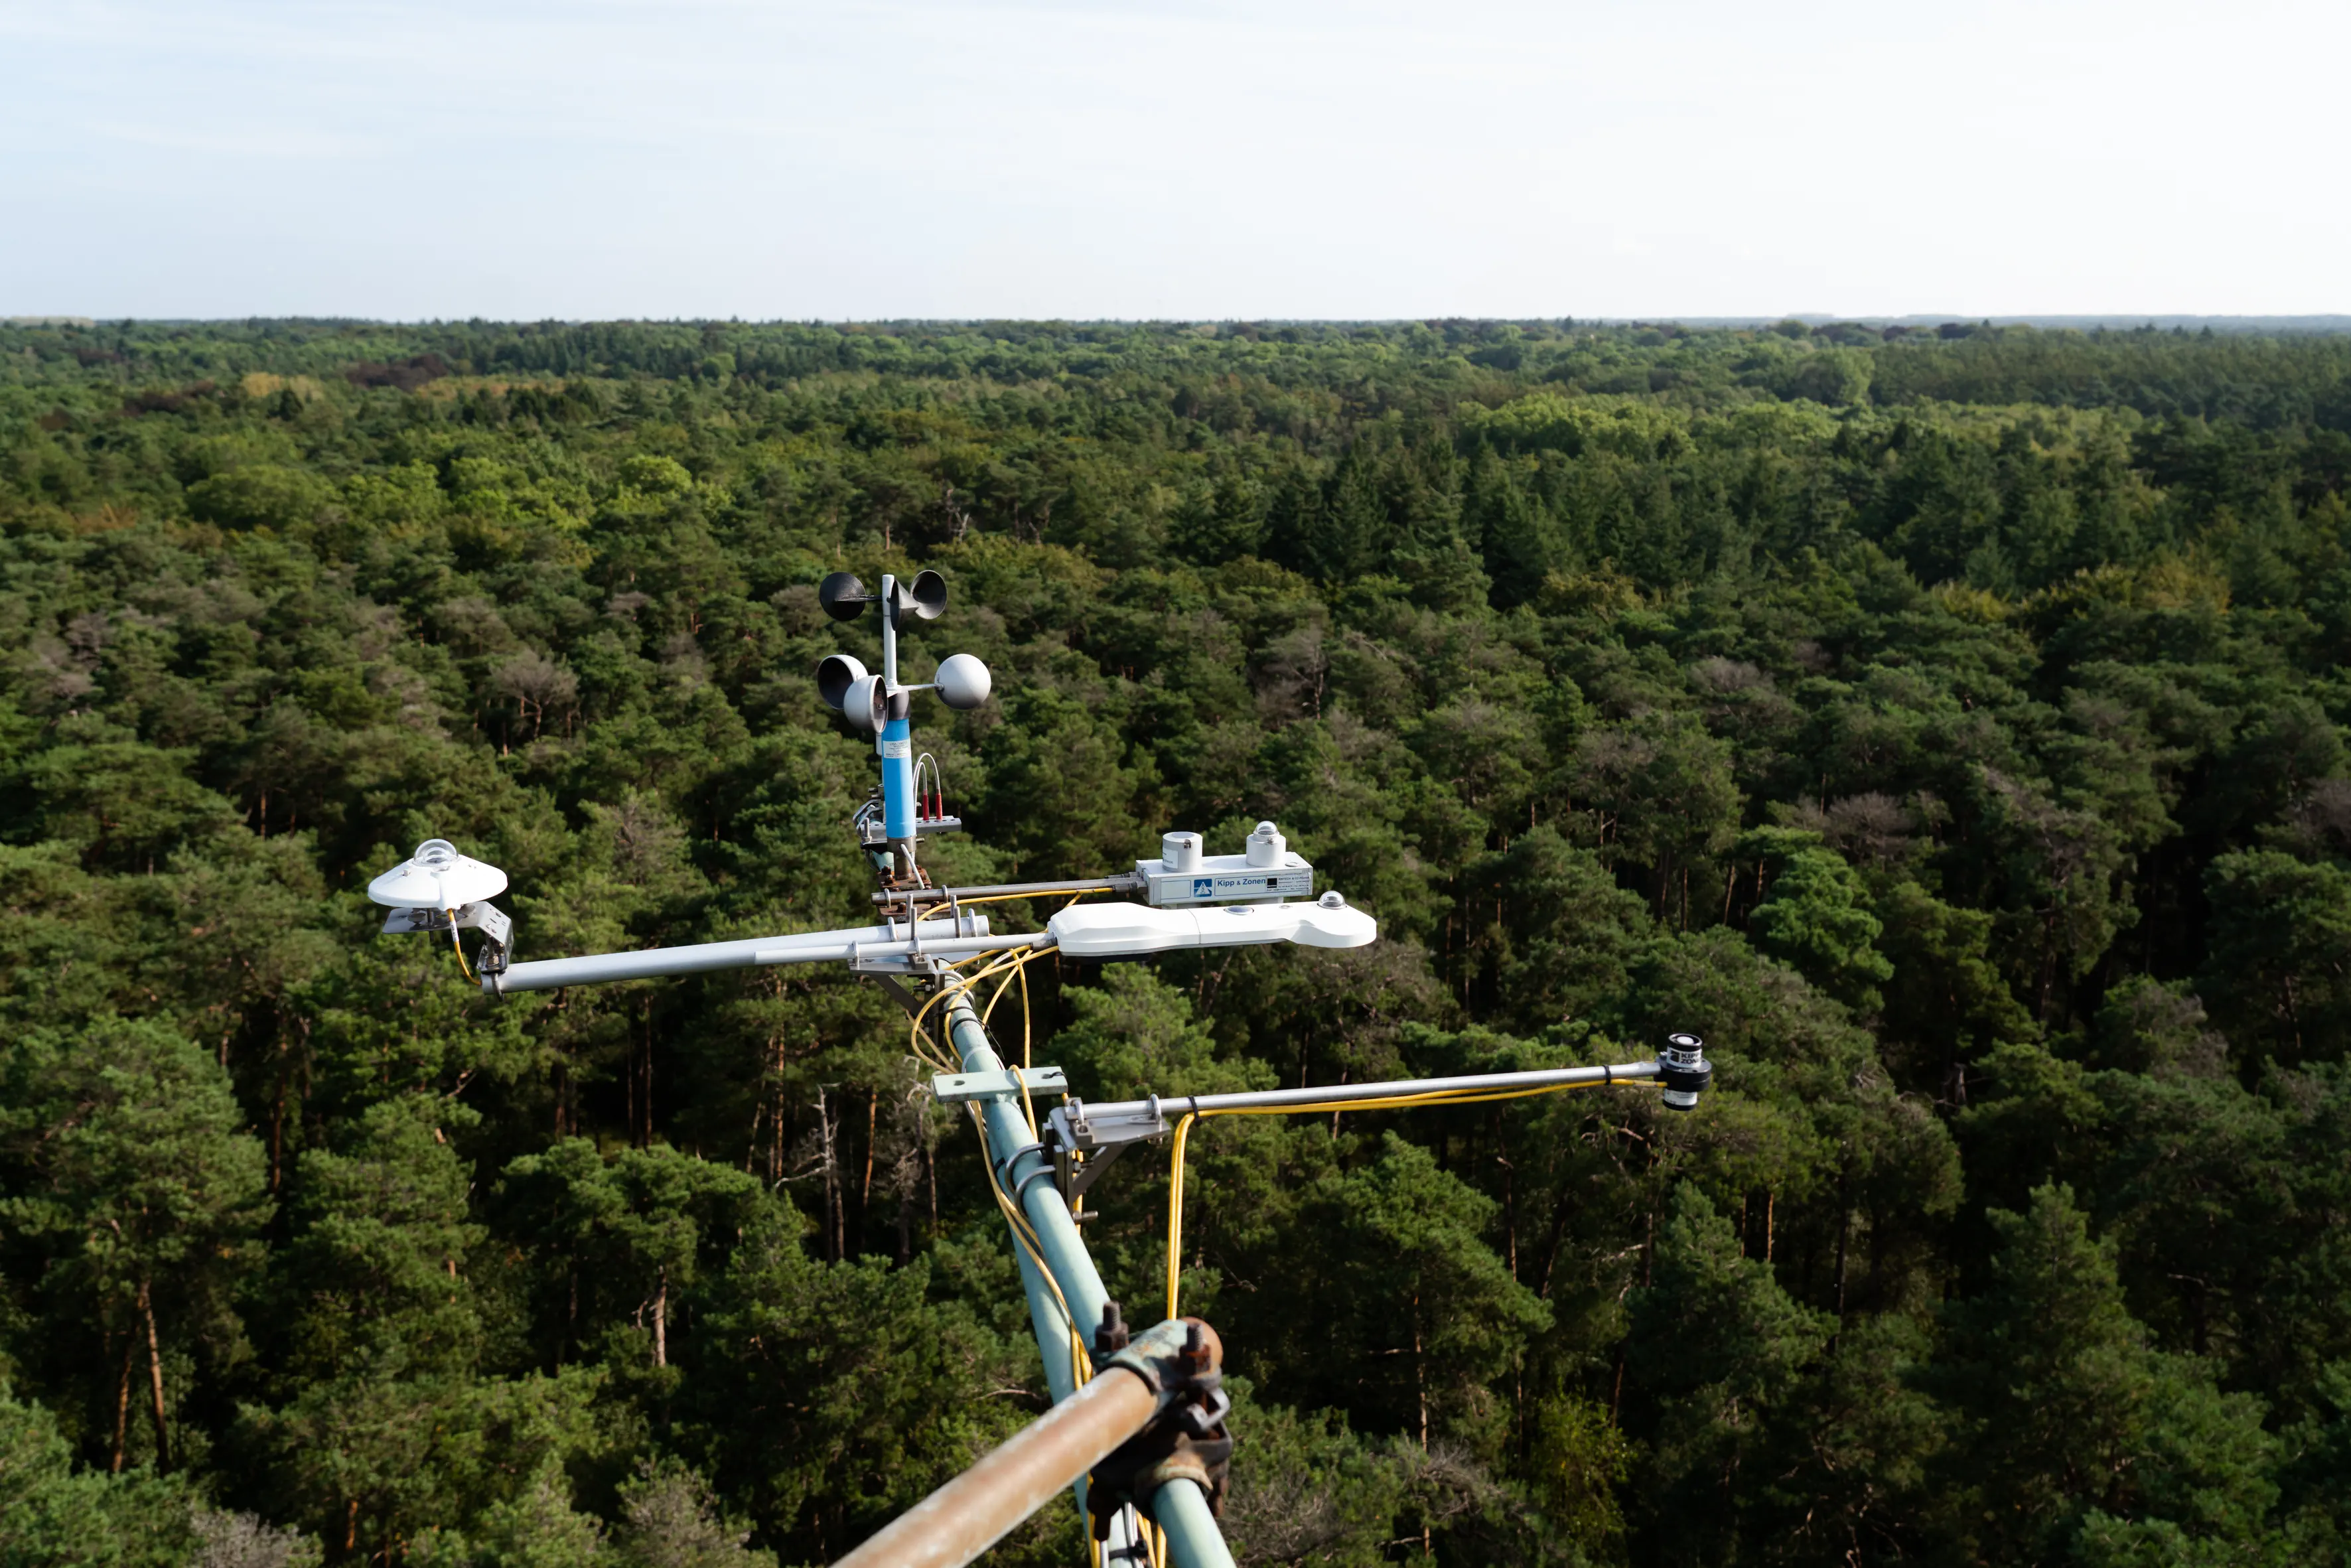
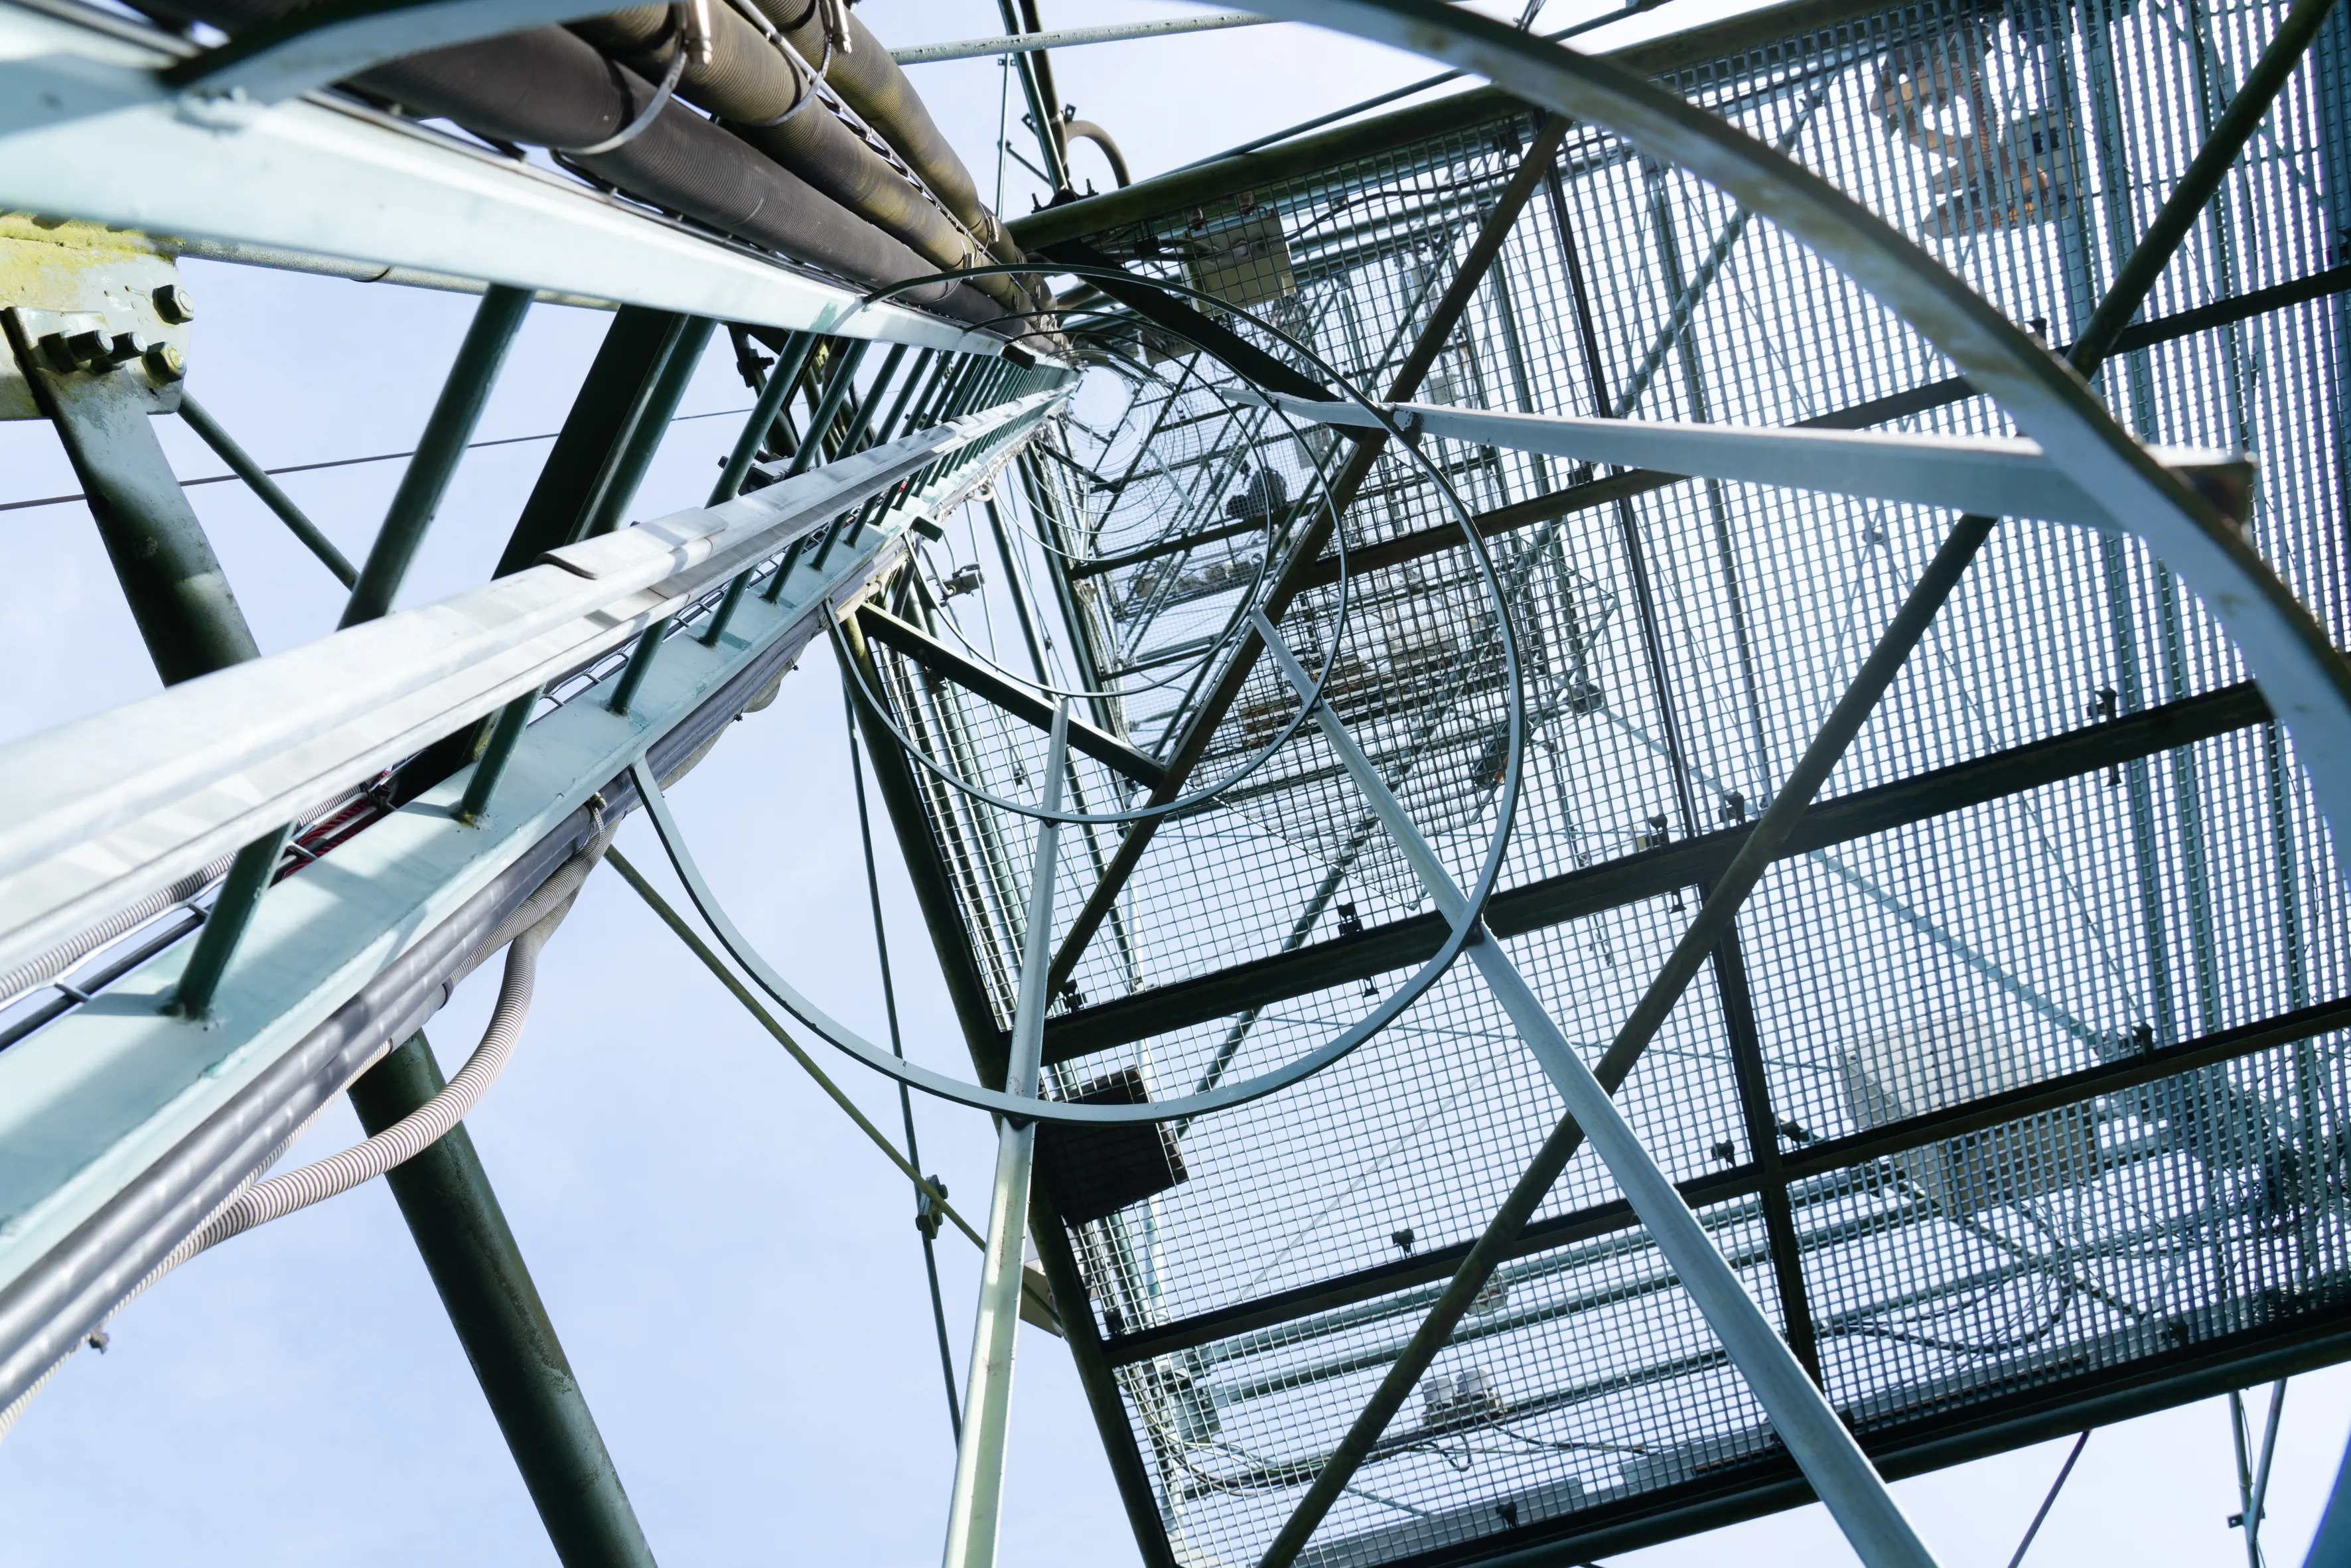
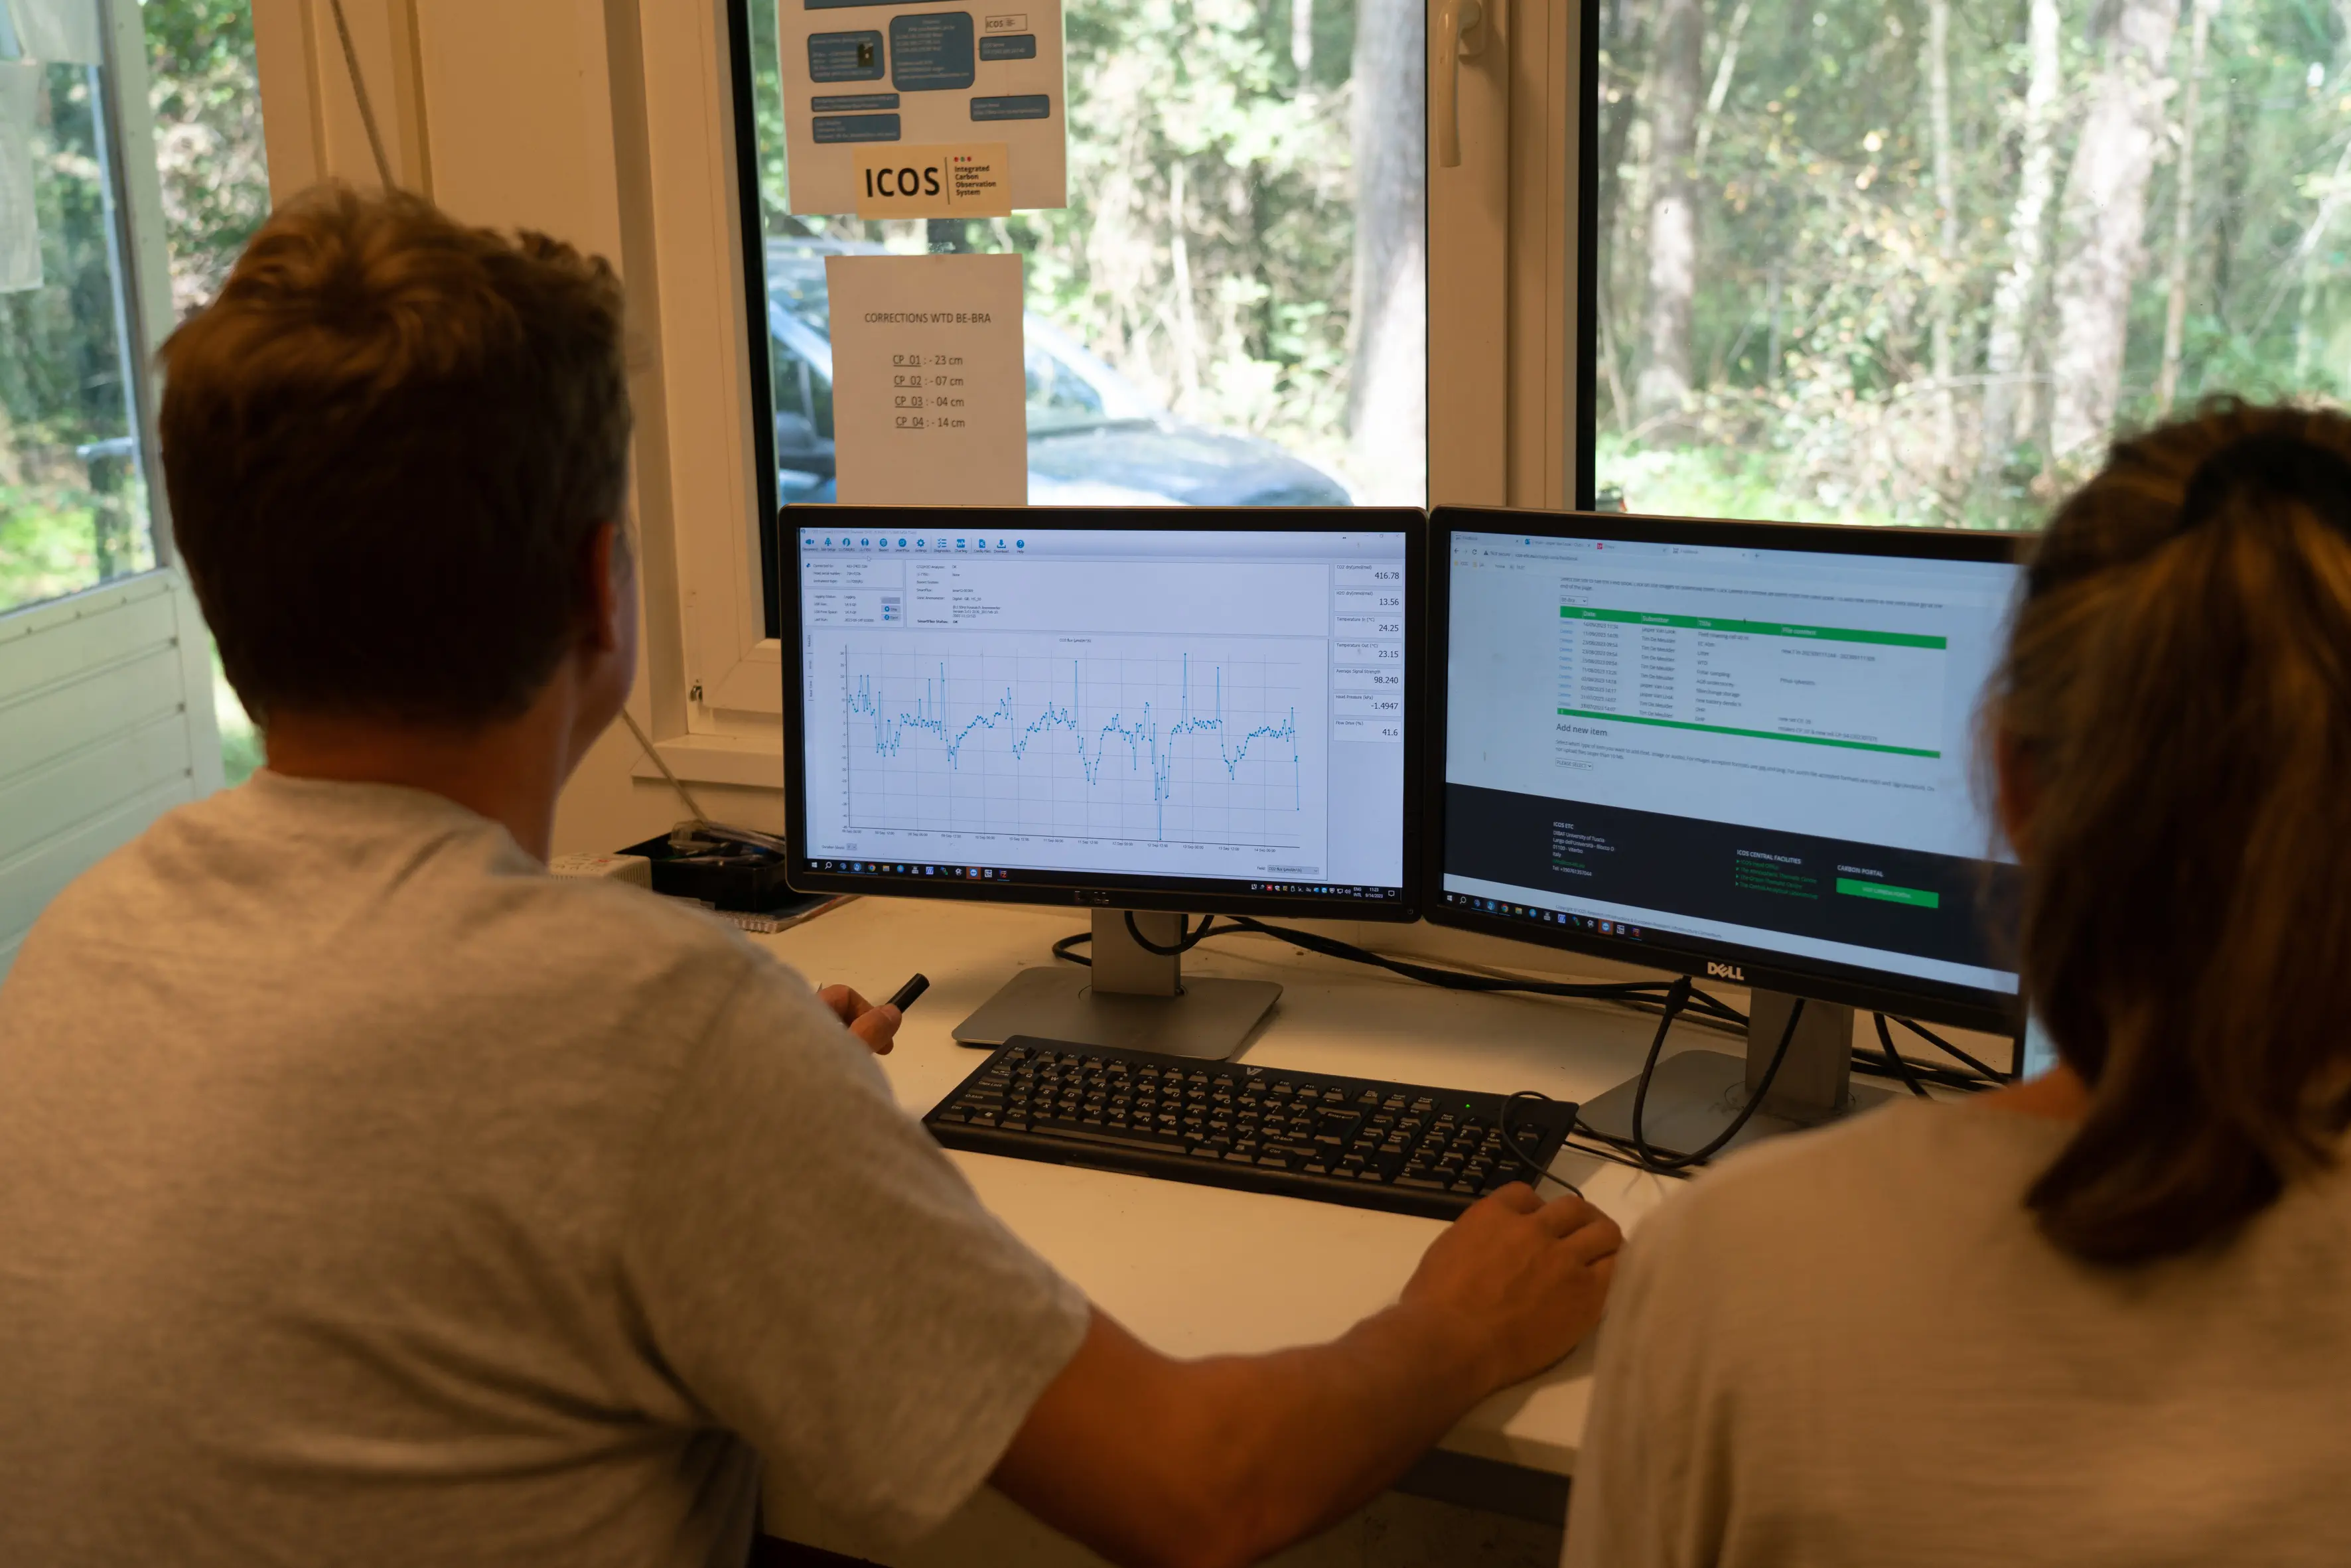
The Research Institute of Nature and Forest (INBO) has been monitoring meteorological variables and air pollution at this station since 1995 on a 40 m scaffolding tower. The University of Antwerp started measuring CO2 fluxes and meteorological drivers in 1997, making this site one of the oldest flux stations worldwide. The station was updated to meet the ICOS requirements and was officially labelled as an ICOS Class 1 Ecosystem station in 2020. Eddy covariance measurements are made at two different heights (40 m ‘historical dataset’, and 32 m ‘ICOS dataset’). The ICOS station is operated by University of Antwerp (PLECO). This station is also part of the LTER network.
Station PI: Prof. dr. Ivan Janssens (Ivan.Janssens@uantwerpen.be)
Full dataset: Brasschaat (icos-cp.eu)
 Webcam image
Station facts
ICOS Class 1 station BE-Bra
- Located in Scots pine dominated forest, planted in 1929 near urban area
- Coordinates: 51°18'27.4"N 4°31'11.4"E
- Flux and meteorological data since 1997
- 40 m high scaffolding tower with flux measurements at 32 m and 40 m
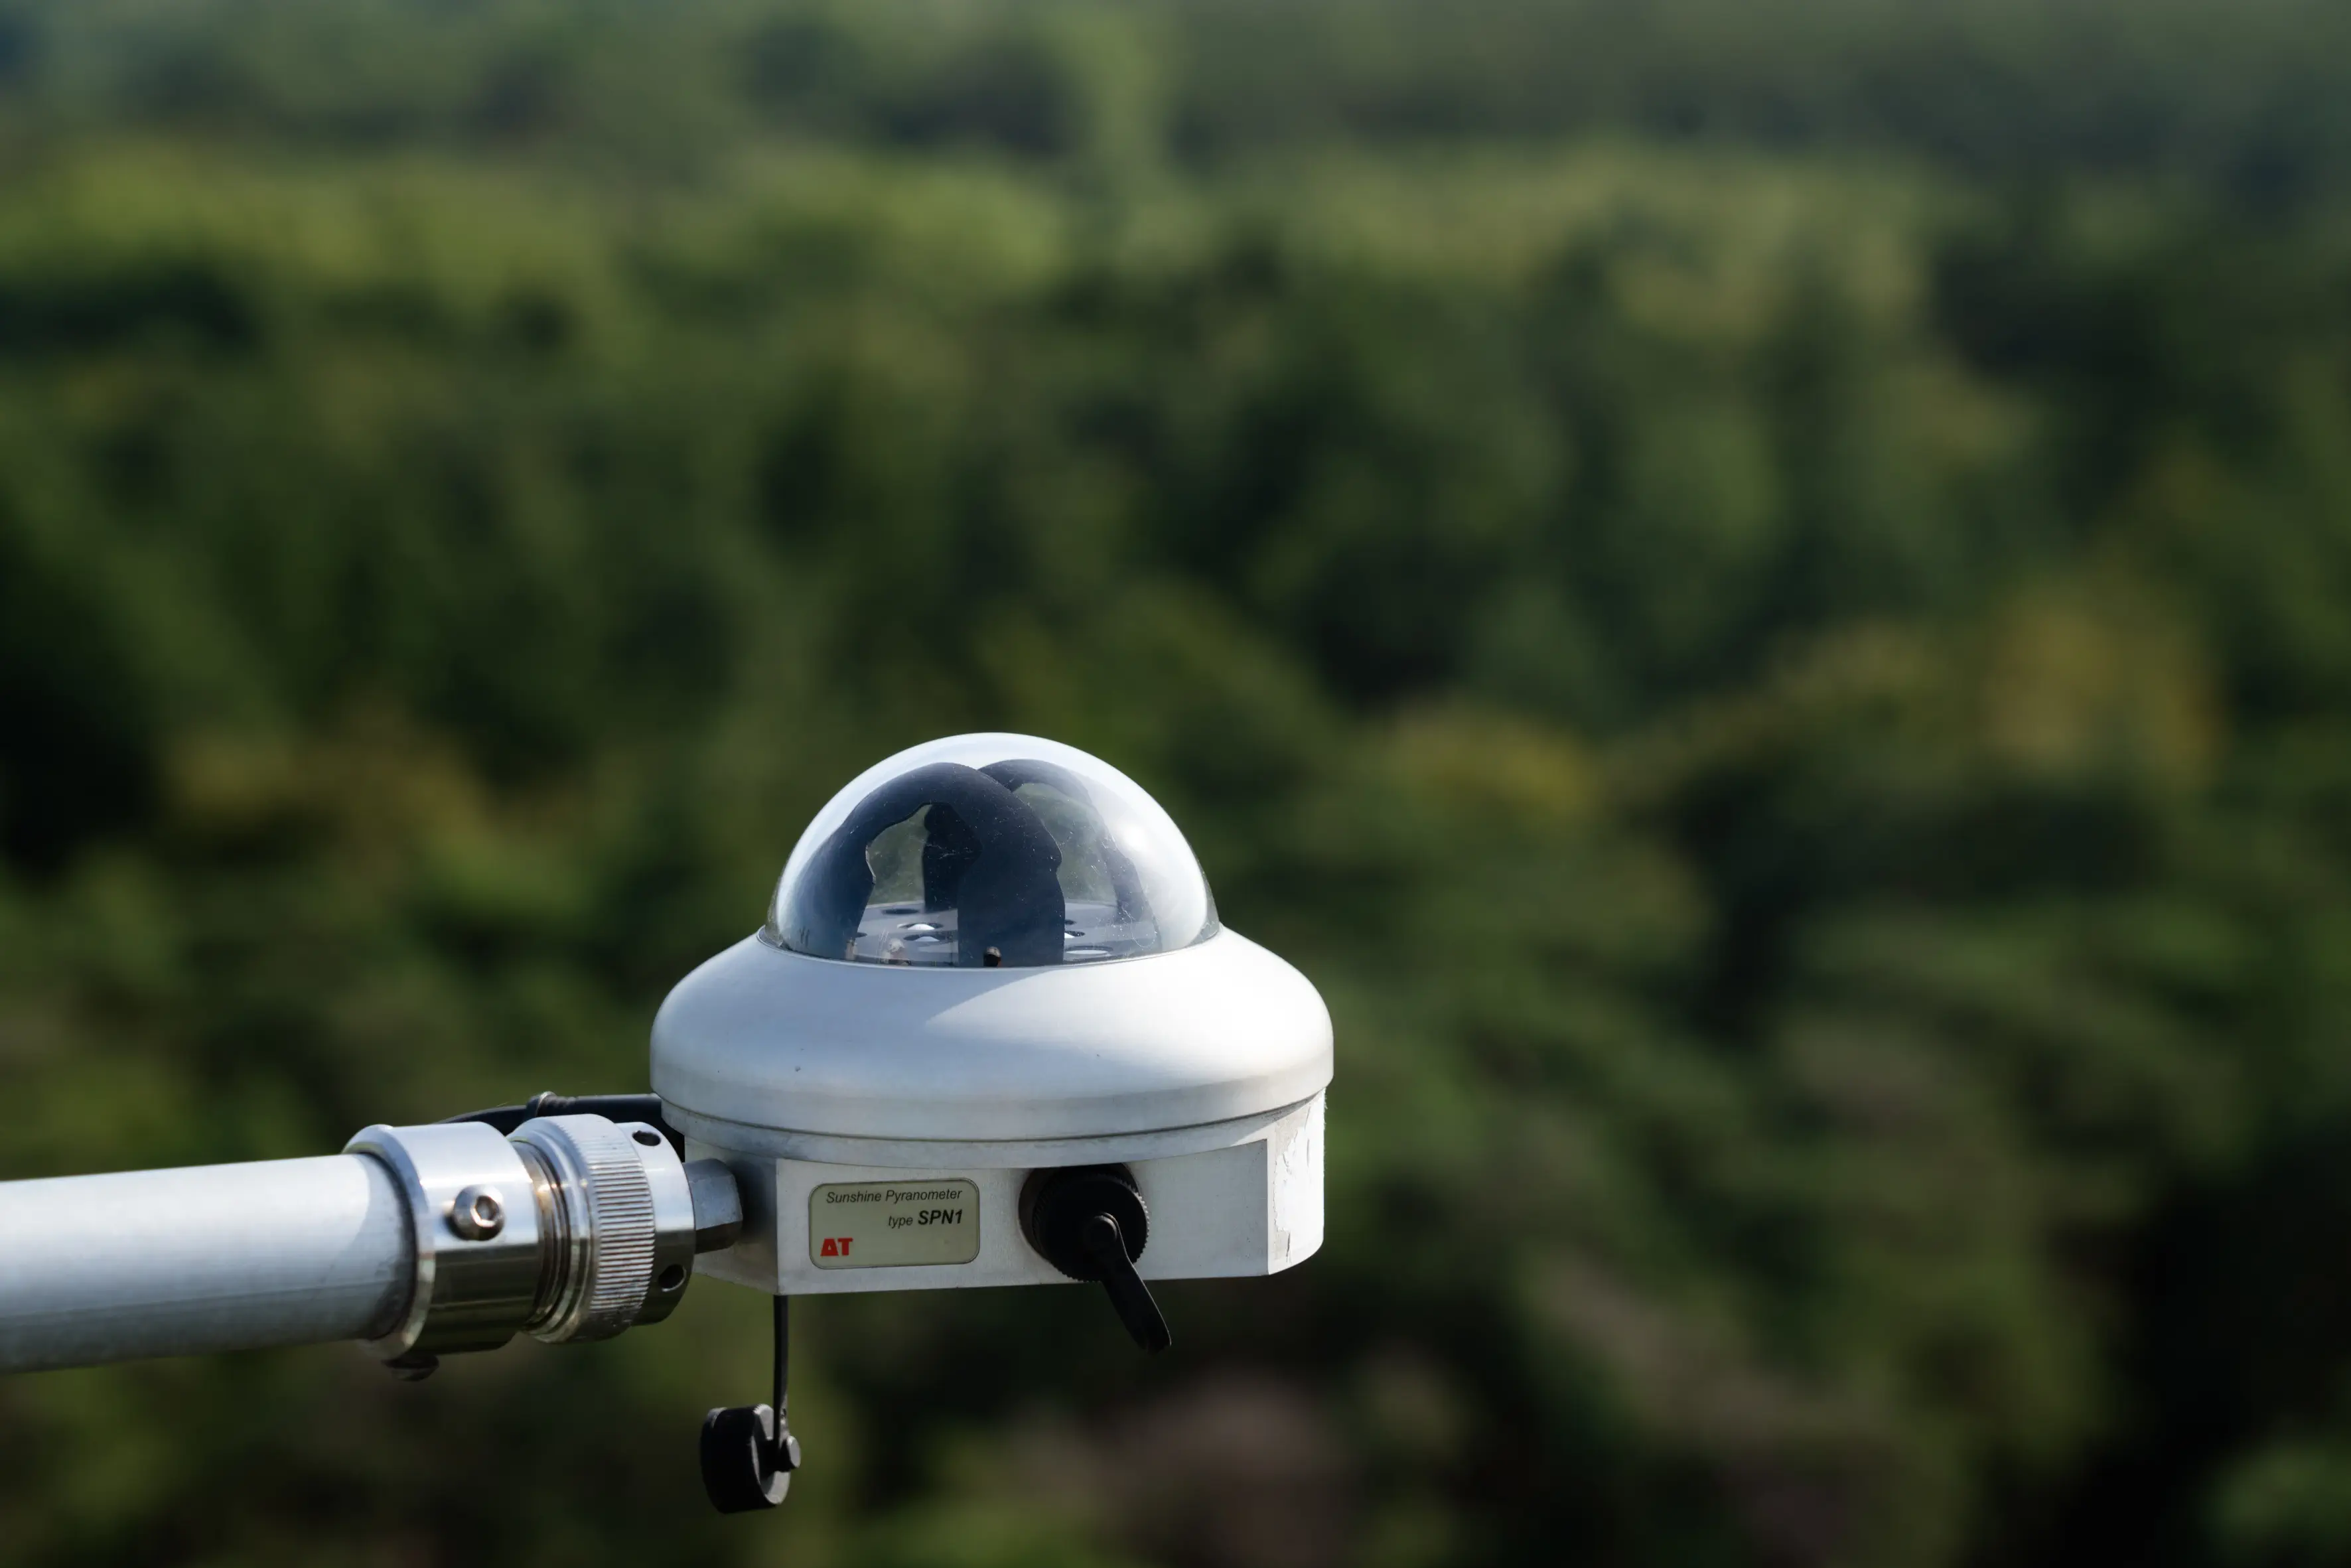
- Measurements of greenhouse gases, ozone and air pollution
- Also part of the LTER network: LTER Brasschaat, Belgium, vegetation data 1996-2017 | DEIMS-SDR
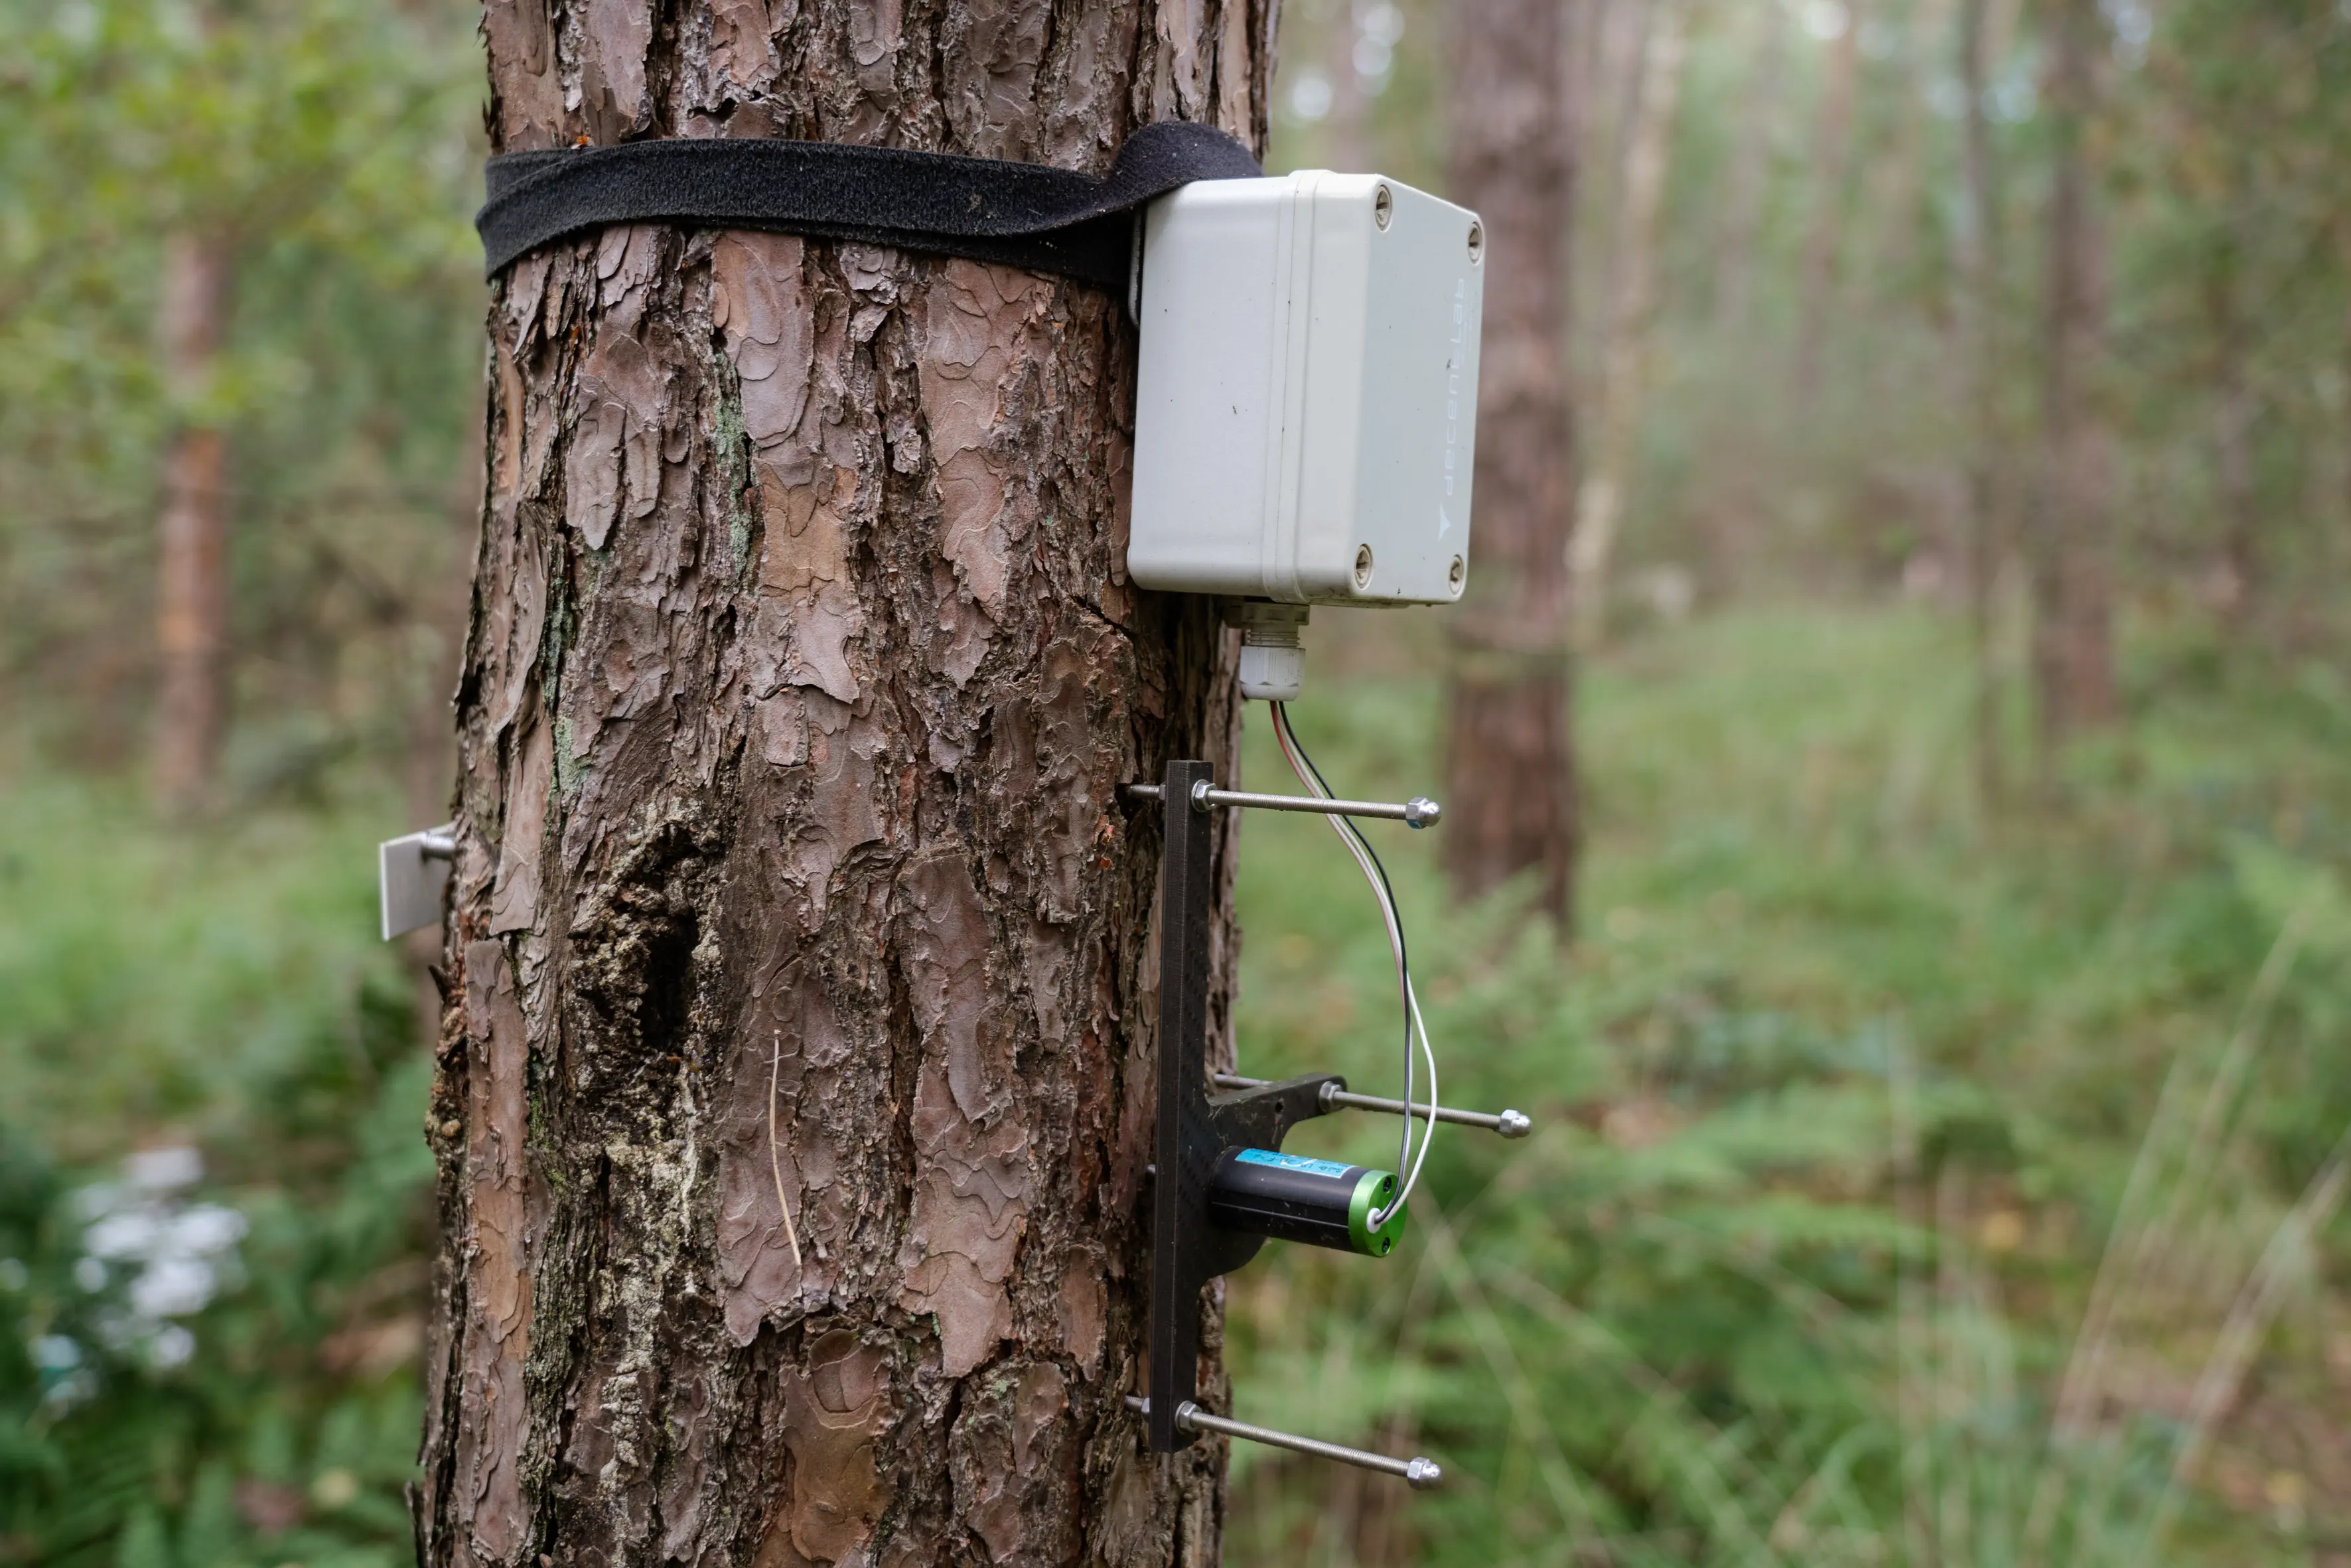
Live measurements
Water
Water input and storage is continuously monitored. A pluviometer measures the amount of precipitation at an open site in the forest. To verify if rainwater also infiltrates the soil, a depth profile of the soil moisture content, as well as the groundwater table are also measured.
Each bar indicates a rain shower. The higher the bar, the more intense the shower.
Green line shows the groundwater table. The more negative the number, the deeper water is stored underground and the lower the availability of water in the soil.
Carbon balance
Plants continuously exchange CO2 with the atmosphere. During the day, plants take up and use CO2 from the air for photosynthesis, in order to grow. On the other hand, plants also continuously emit CO2 as a result of maintenance processes. The net sum of this uptake and emission defines how much CO2 the forest absorbs. This net flux depends on many factors, including the season, the availability of sunlight and water, and the soil quality.
Research of Horemans et al. (2020) indicates that the Brasschaat forest was an overall source of CO2 before 2000, meaning that the forest emitted more than it absorbed. Carbon sequestration capacity thereafter improved over time, mainly due tothe soil recovering from acidification (after measures to restrict ‘acid rain’ were implemented by the government). Today the forest is an overall CO2 sink. This graph shows live data from this year’s CO2 balance at the Brasschaat site.
Bars indicate the net CO2 emission or uptake. Red bars show when the forest emits CO2, green bars when the forest absorbs CO2.