
Maasmechelen
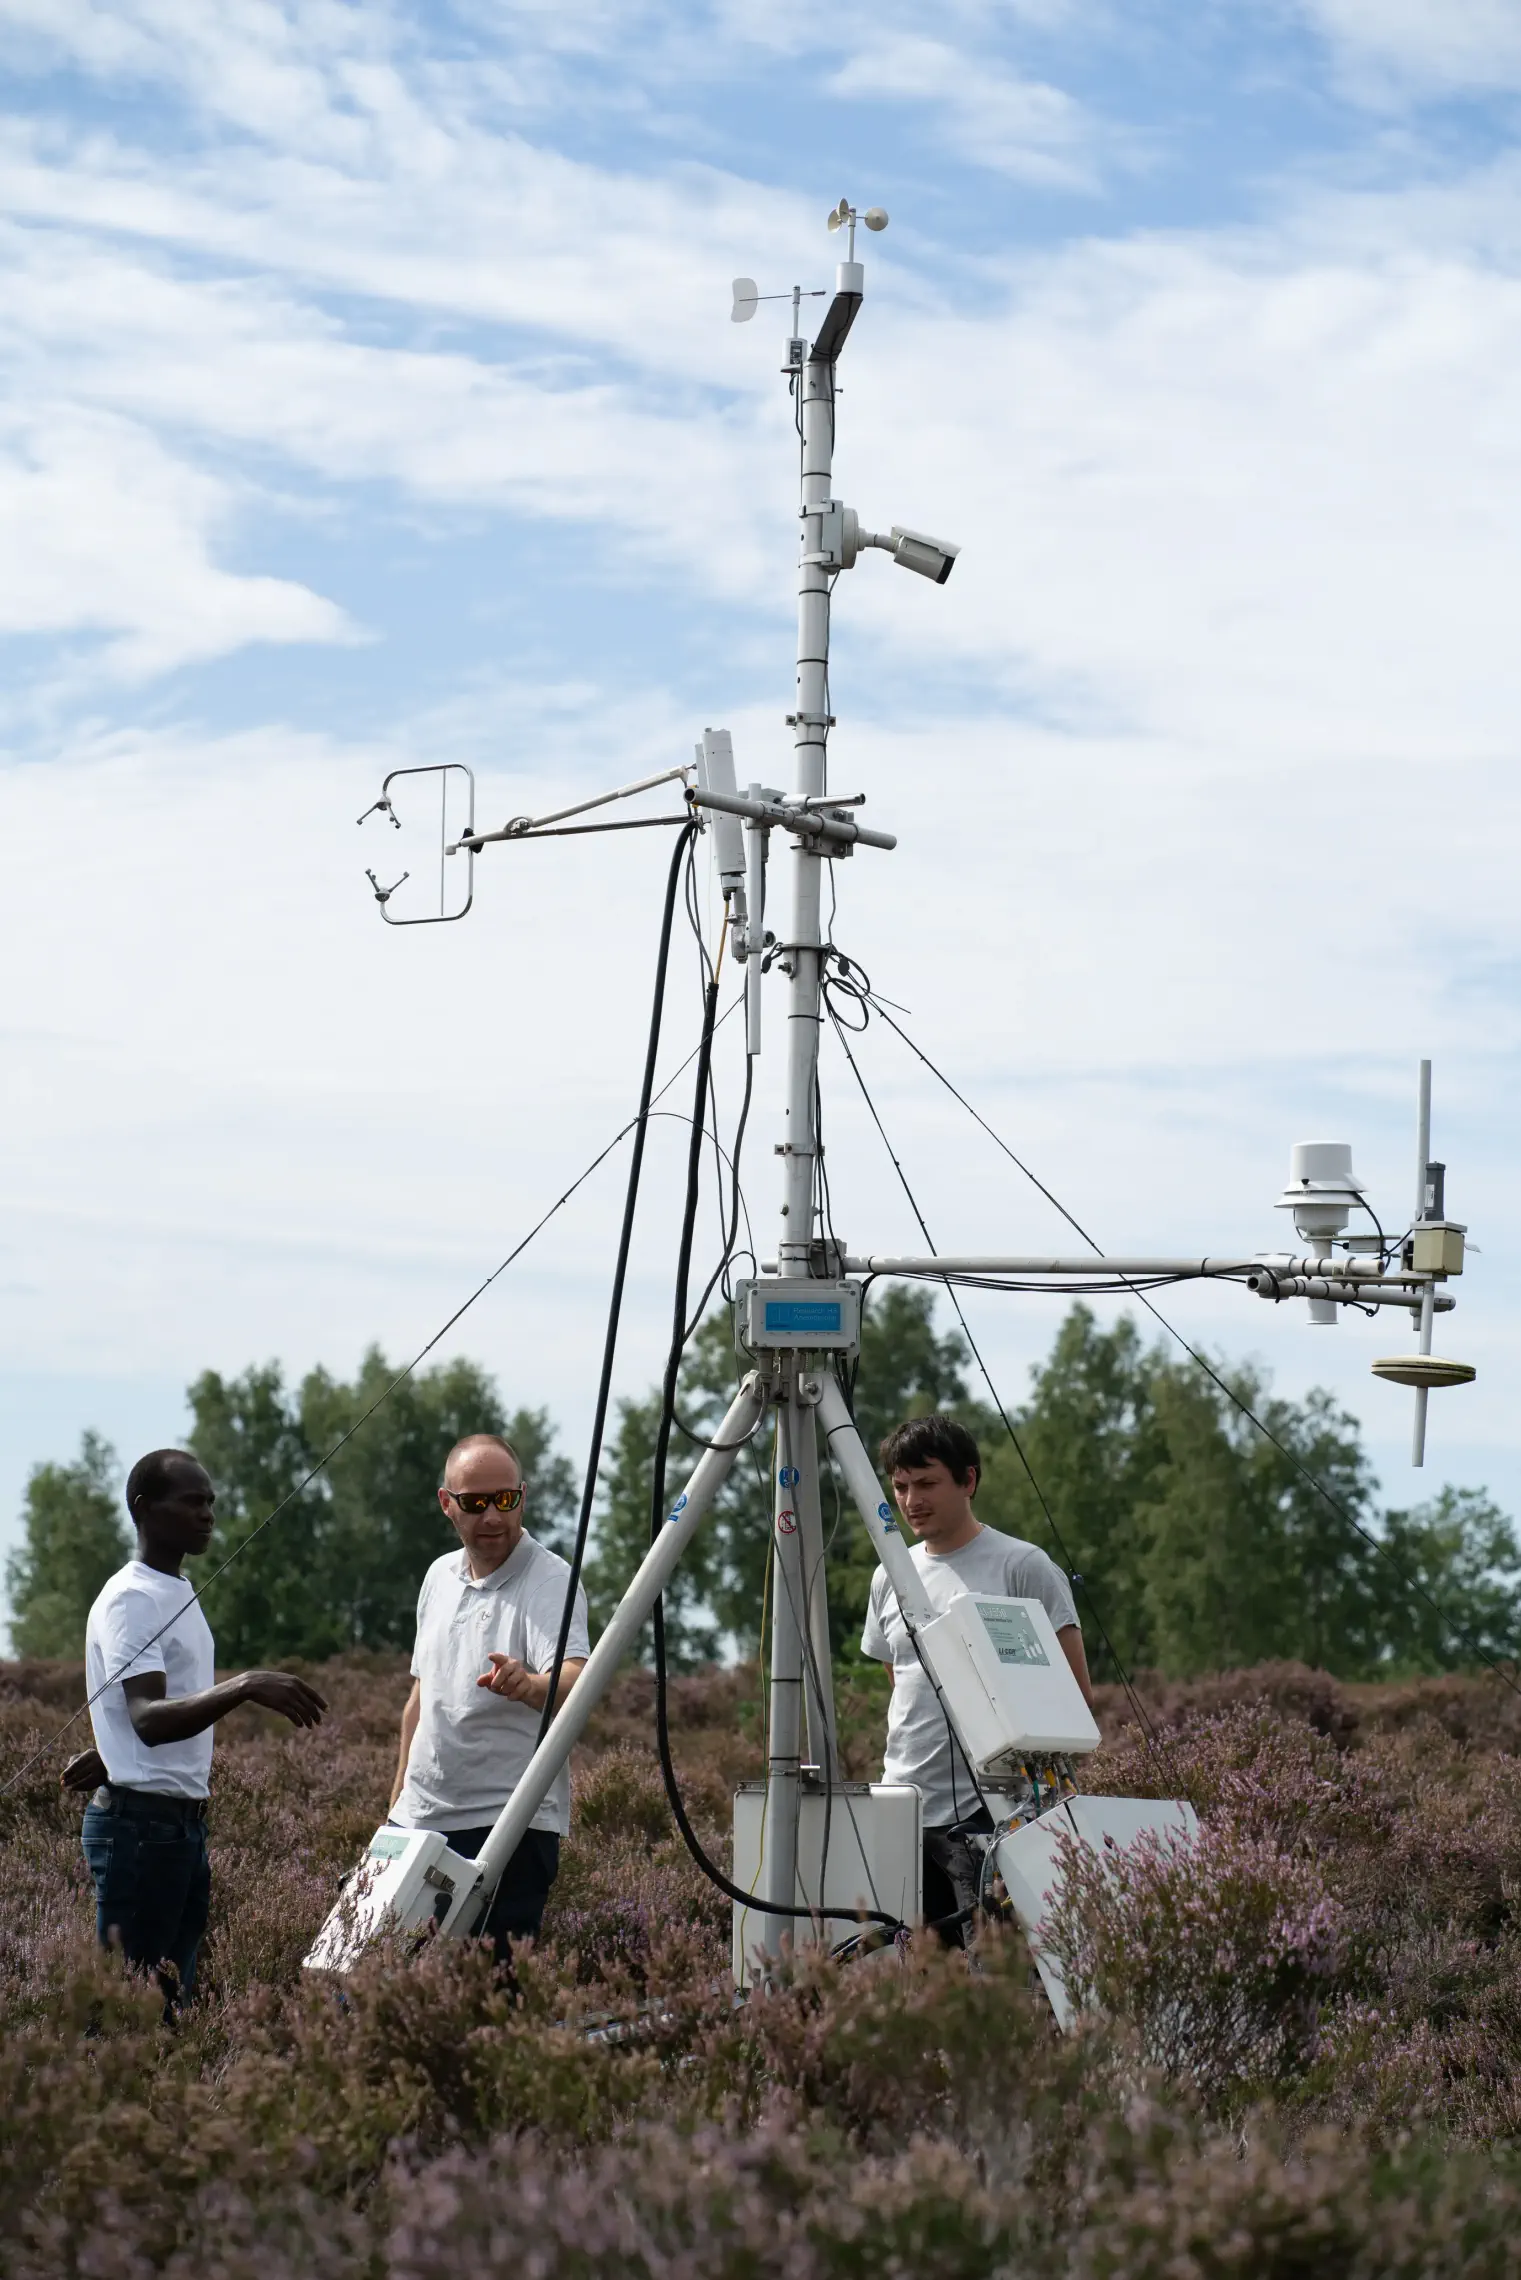
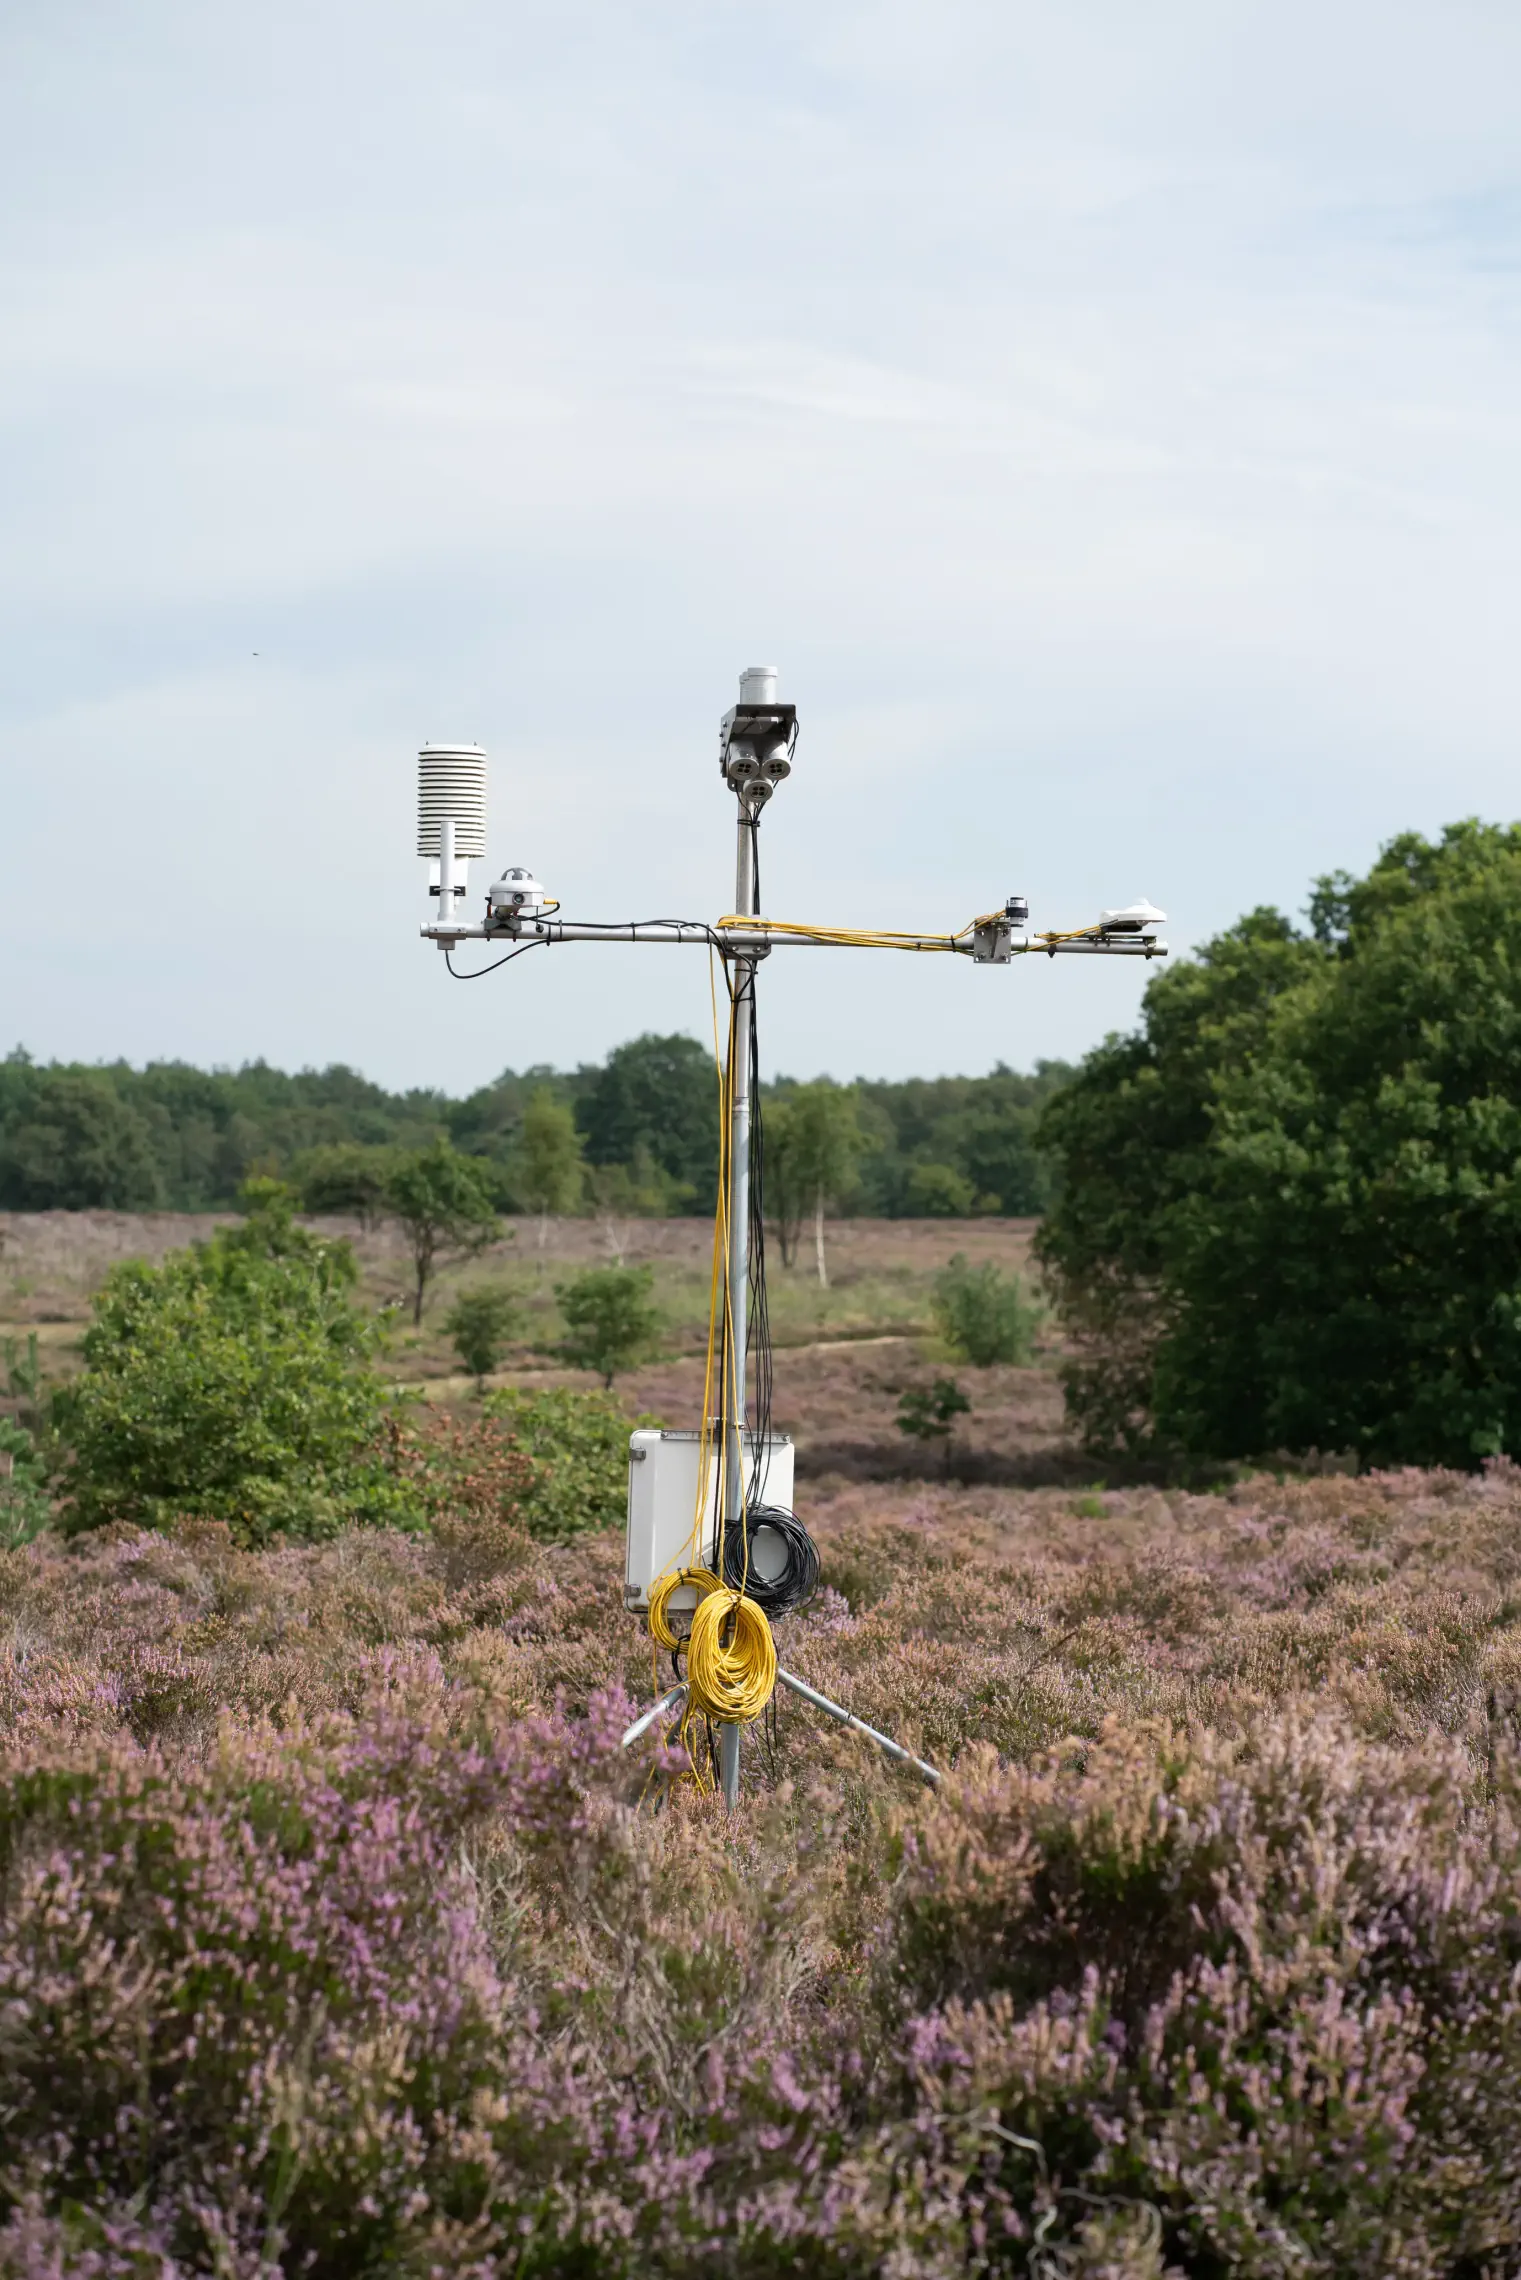
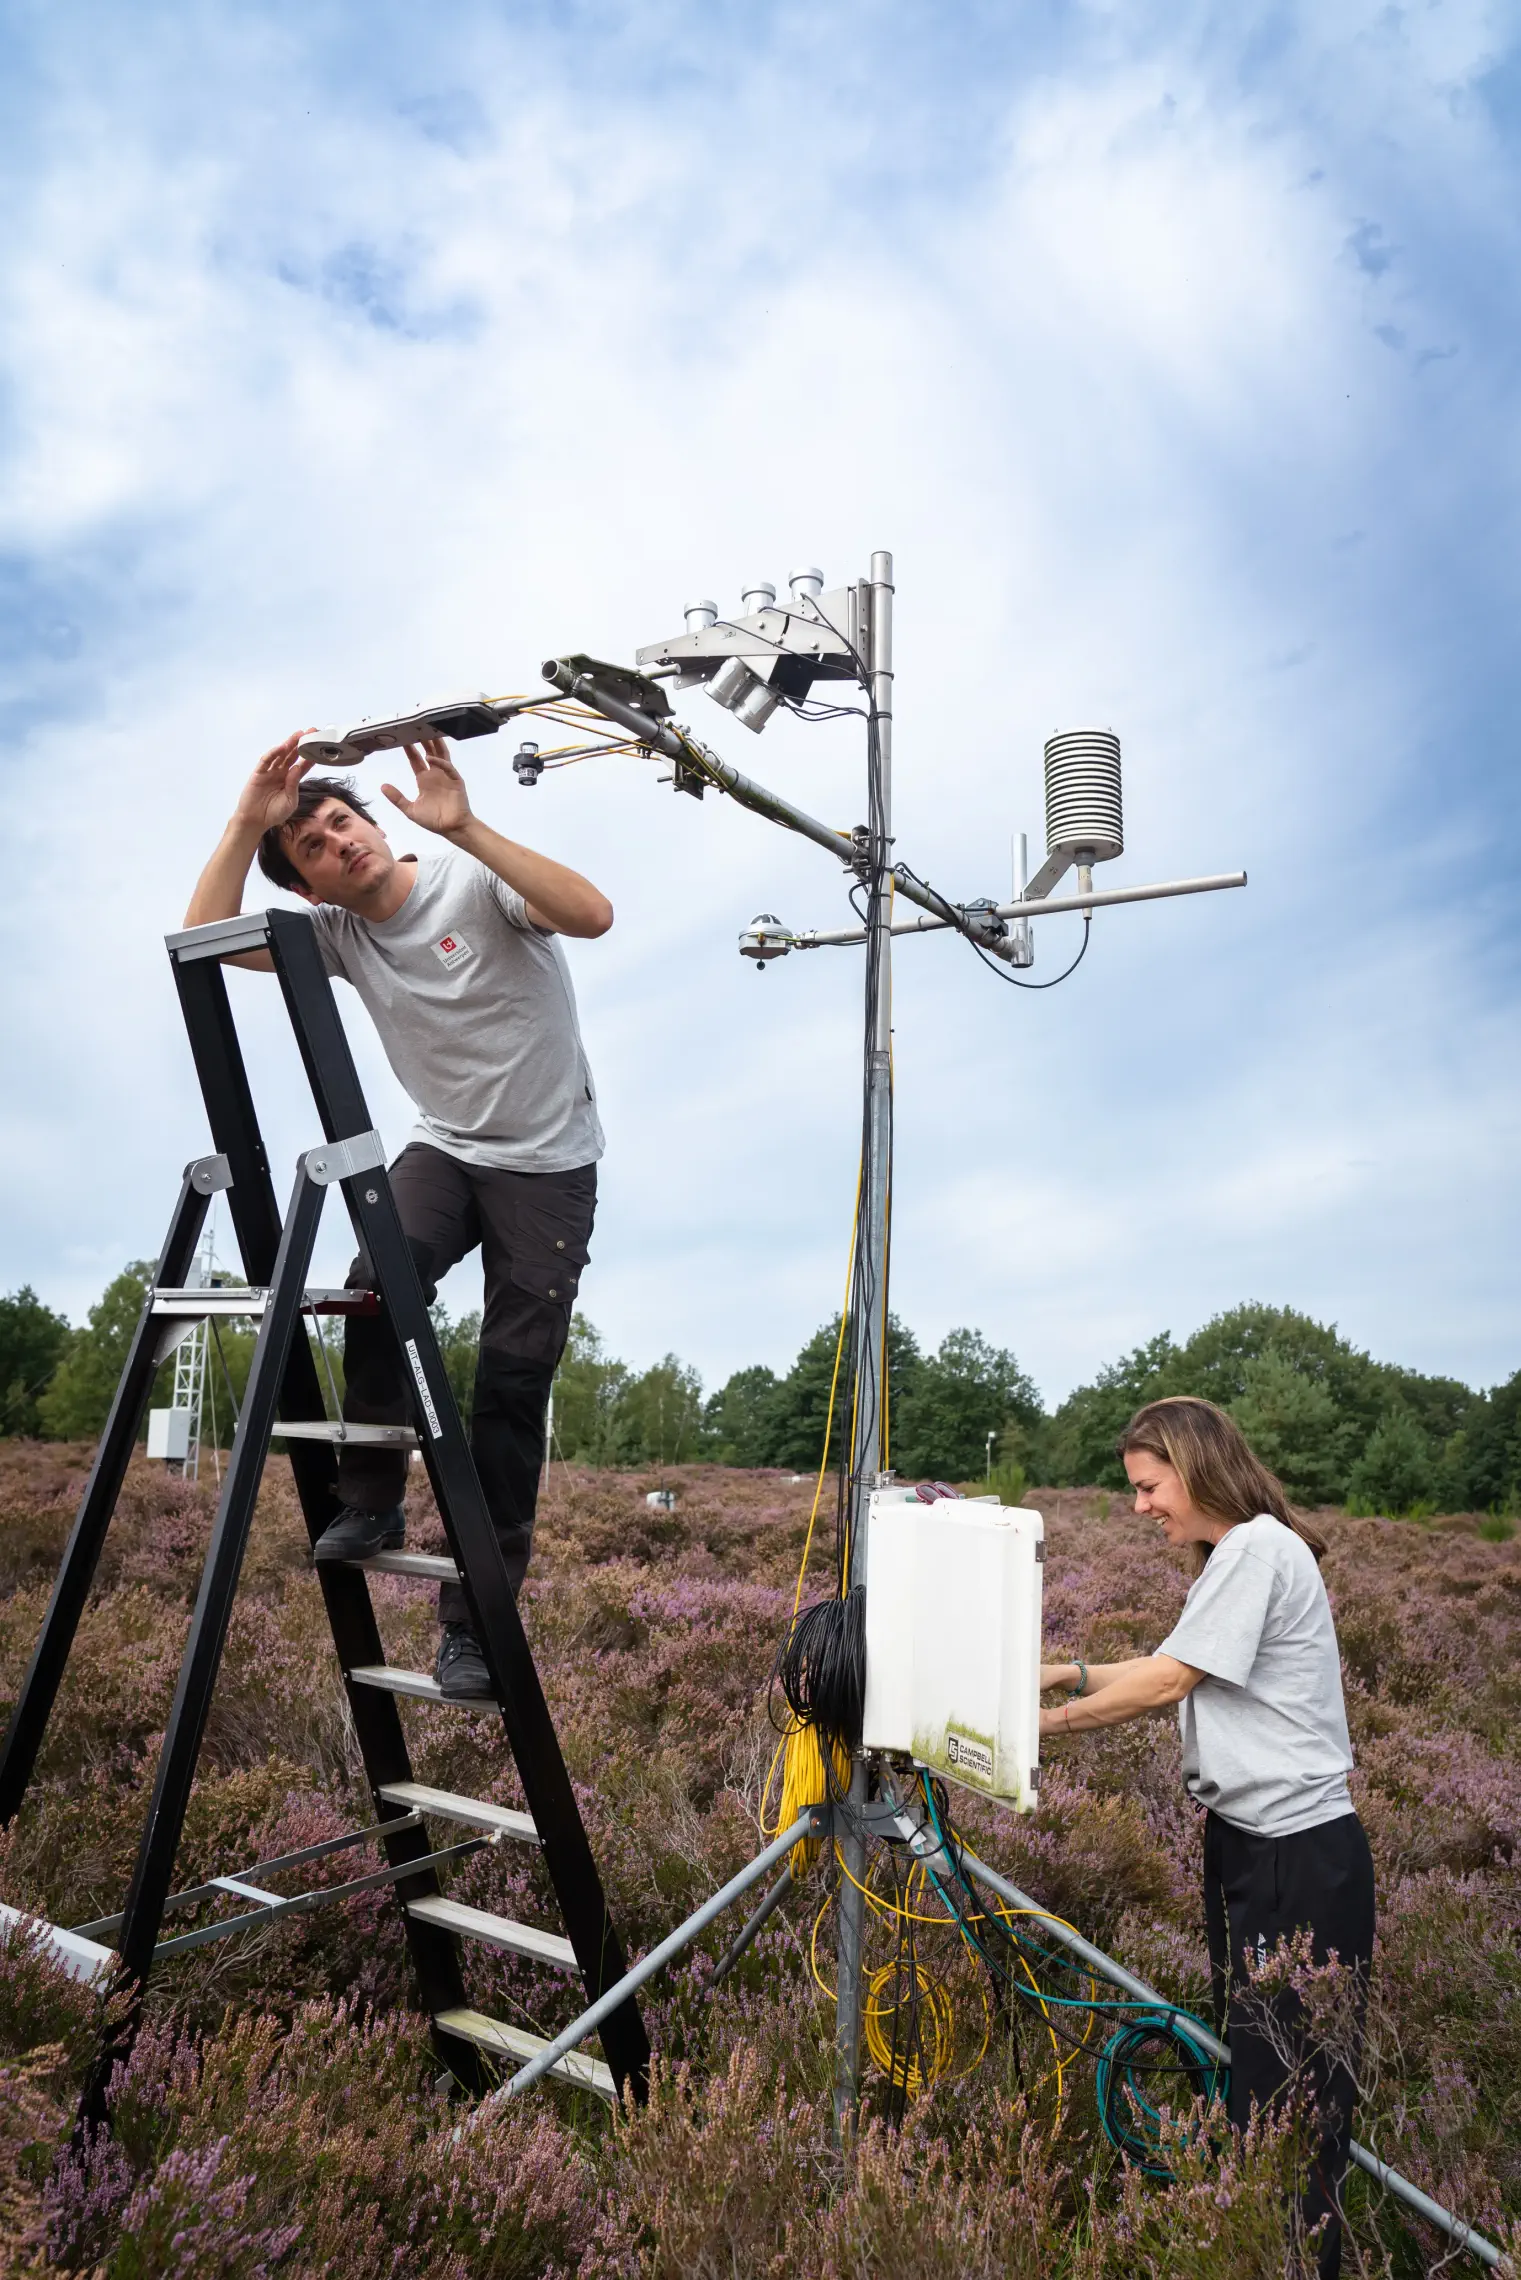
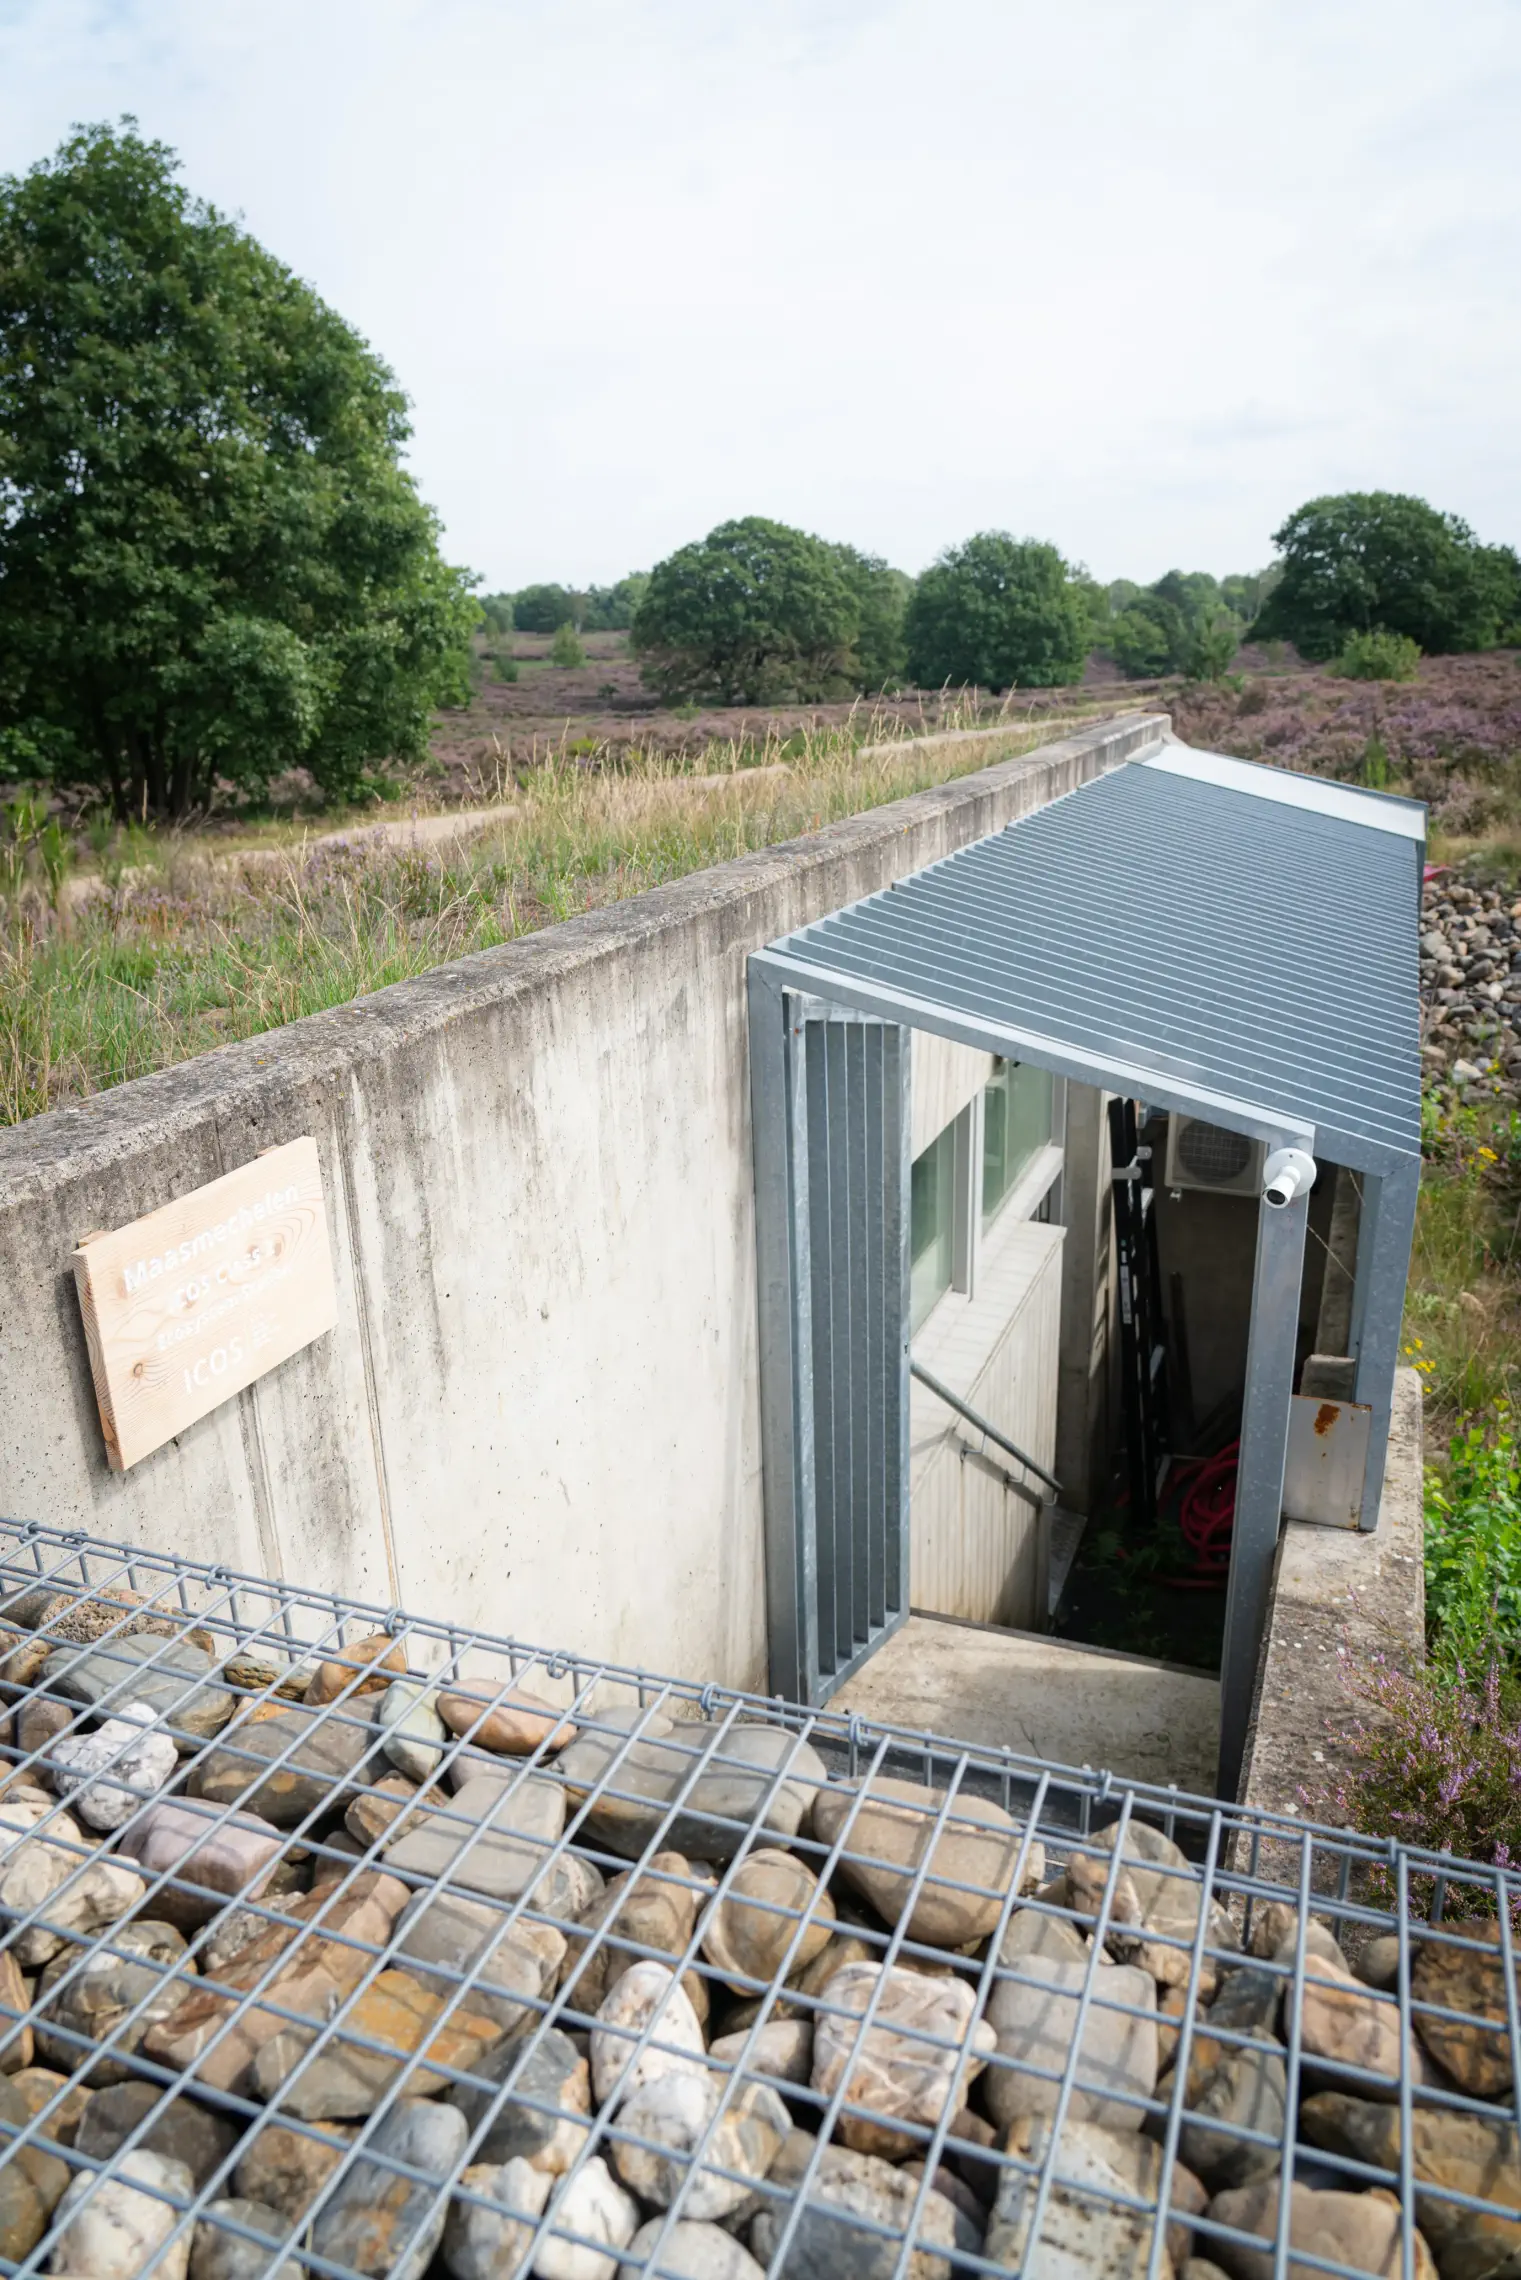
The ecosystem station in Maasmechelen is a dry heathland site 10 km northeast of the city of Genk and located in the National Park 'Hoge Kempen'. The national park was founded in 2006 and has a total area of 127 km² . The experimental site is situated in a 400 ha heathland called Mechelse heide, and it is a shrubland dominated by common heather (Calluna vulgaris L.), that grows up to one meter high. The national park is managed by the ANB (Agenstschap voor Natuur en Bos). To preserve the landscape in the national park, the technical cabin was designed as a partly underground construction, overgrown with heather.
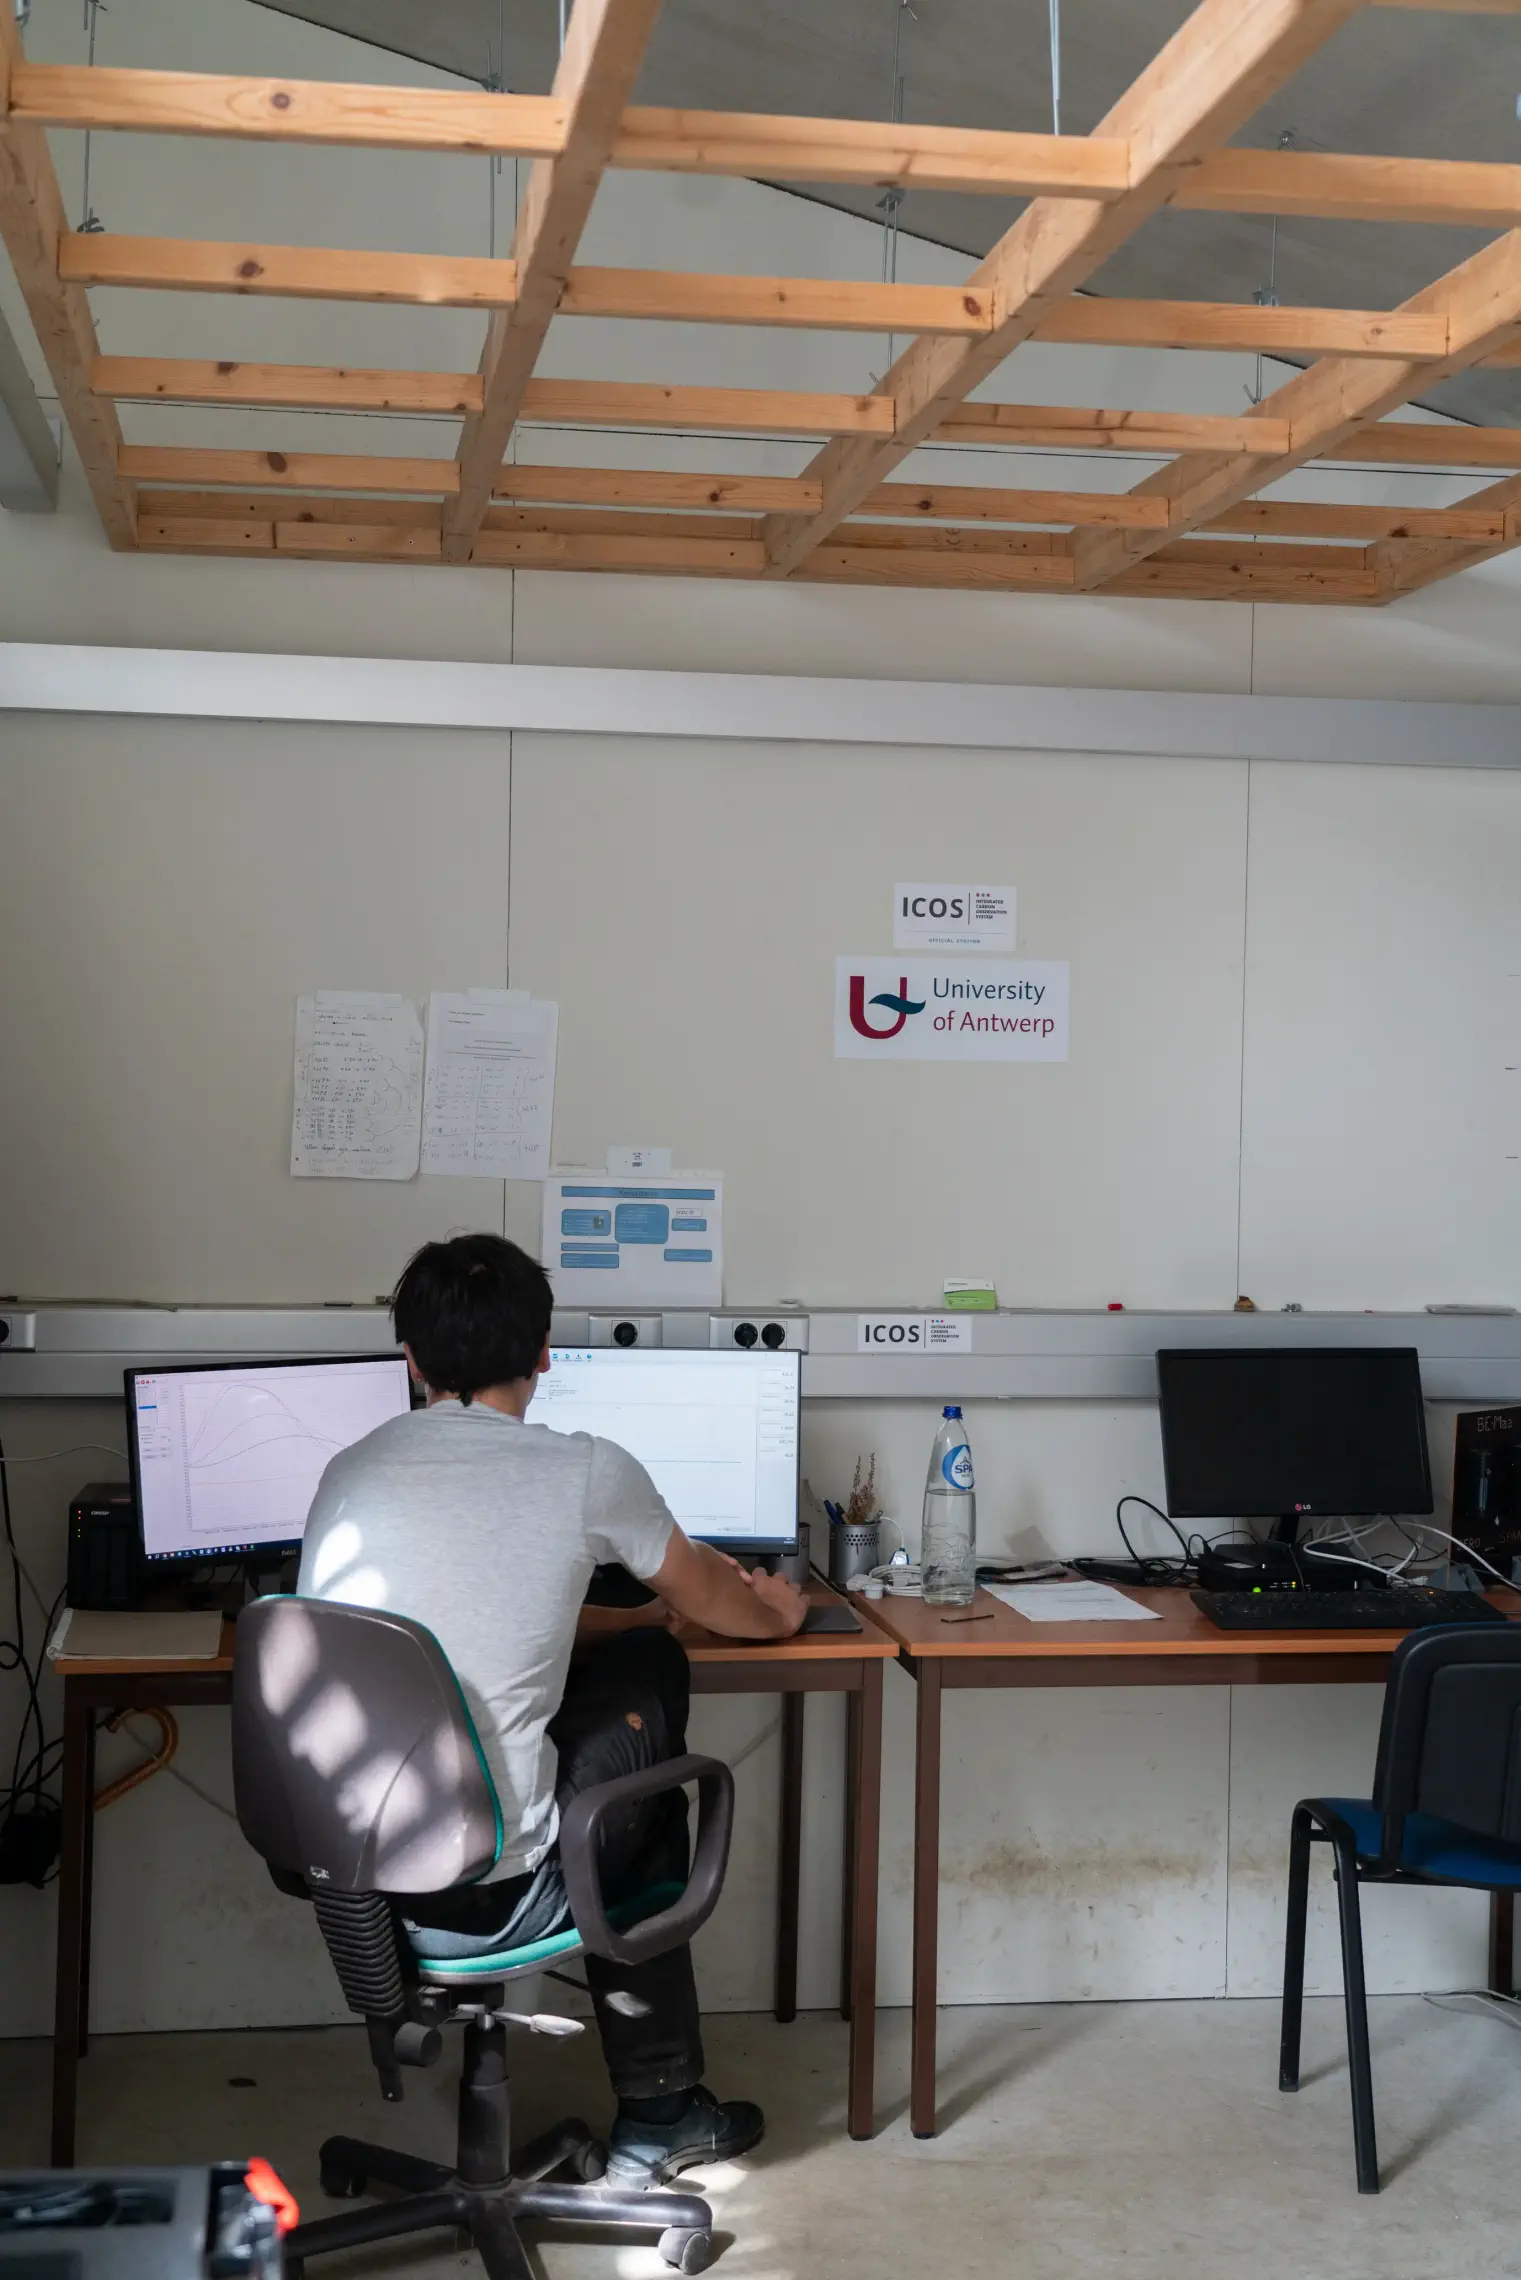
Although the heathland ecosystem is a prominent and valuable ecosystem in Western Europe, Maasmechelen is the only heathland where greenhouse gases are continuously monitored. Flux and meteorological data are measured since the beginning of 2016. The station is closely linked with the ECOTRON from Hasselt University and the ANAEE research infrastructure, as the ICOS tower provides the necessary data to define the natural soil and air conditions in the control chambers of the ECOTRON.
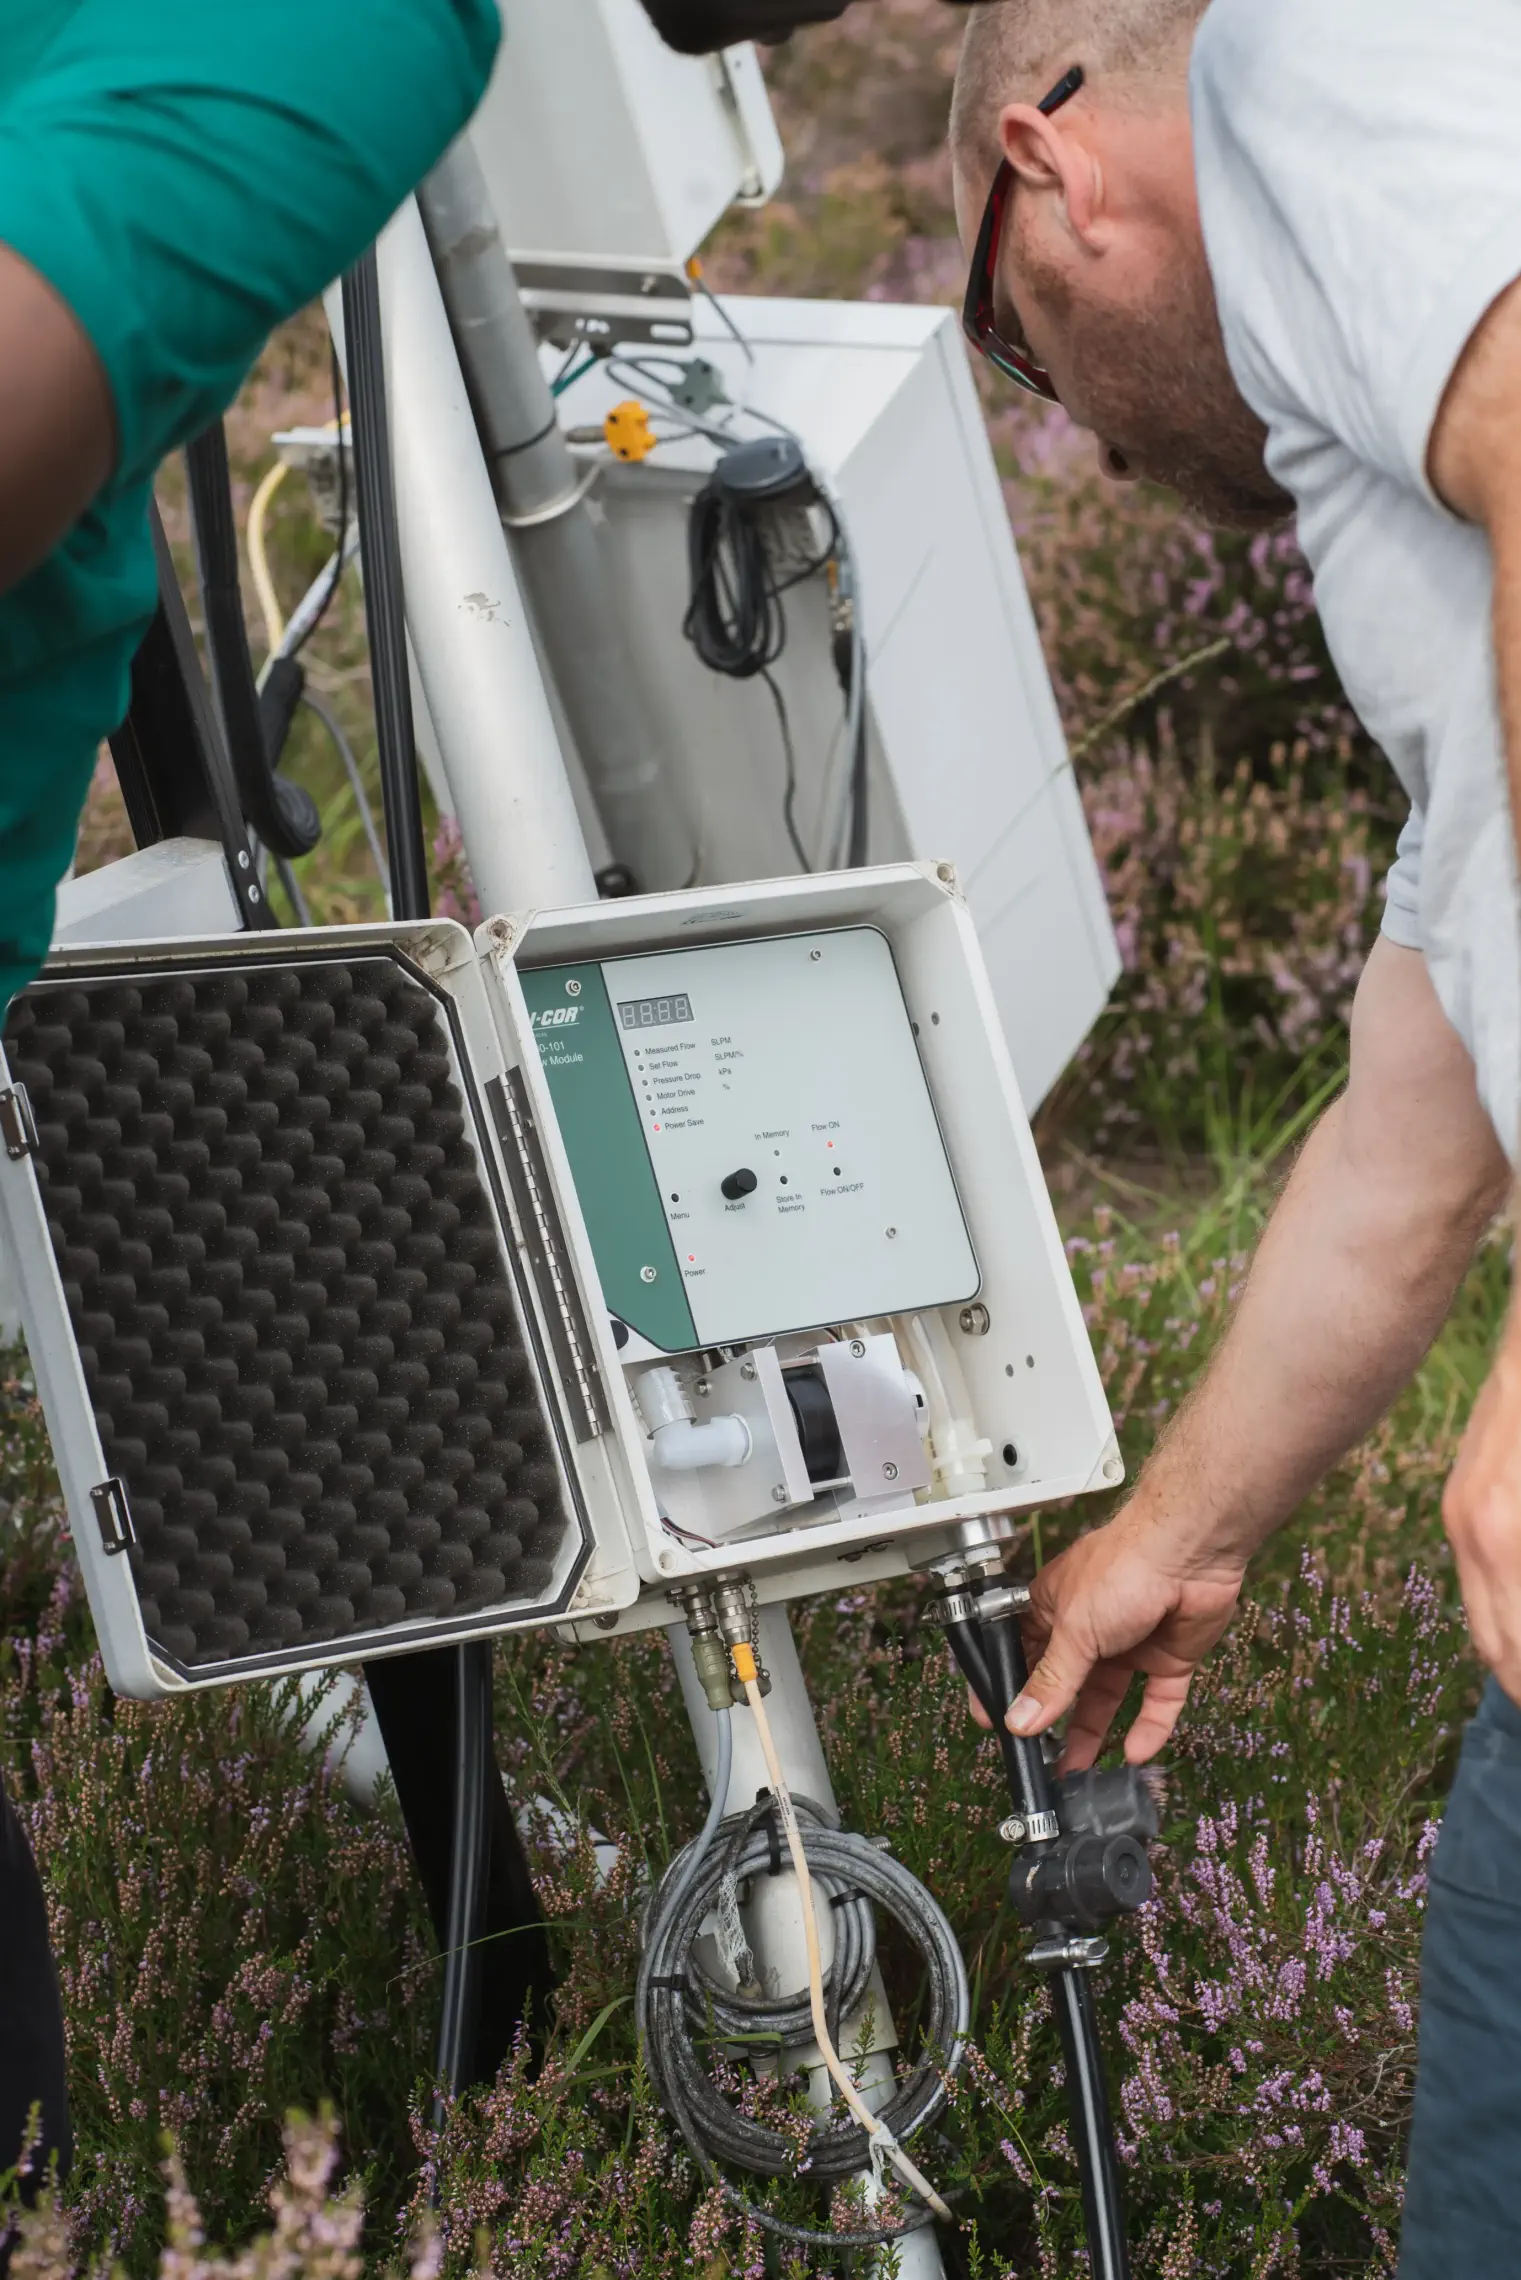
The Maasmechelen station is a good example of how ICOS facilitates other research activities. It hosts instruments of VMM (Vlaamse Milieu Maatschappij) and ISSeP (Institut Scientifique de Service Public) to monitor air quality and deposition fluxes. VMM measures wet deposition (via a ‘wet-only’ device), dry deposition (via COTAG), and concentrations of acidifying and eutrophicating pollutants (via passive samplers). ISSeP measures concentrations of nitrous oxides, ozone and particulate matter via the ‘Saïga’ air quality station.
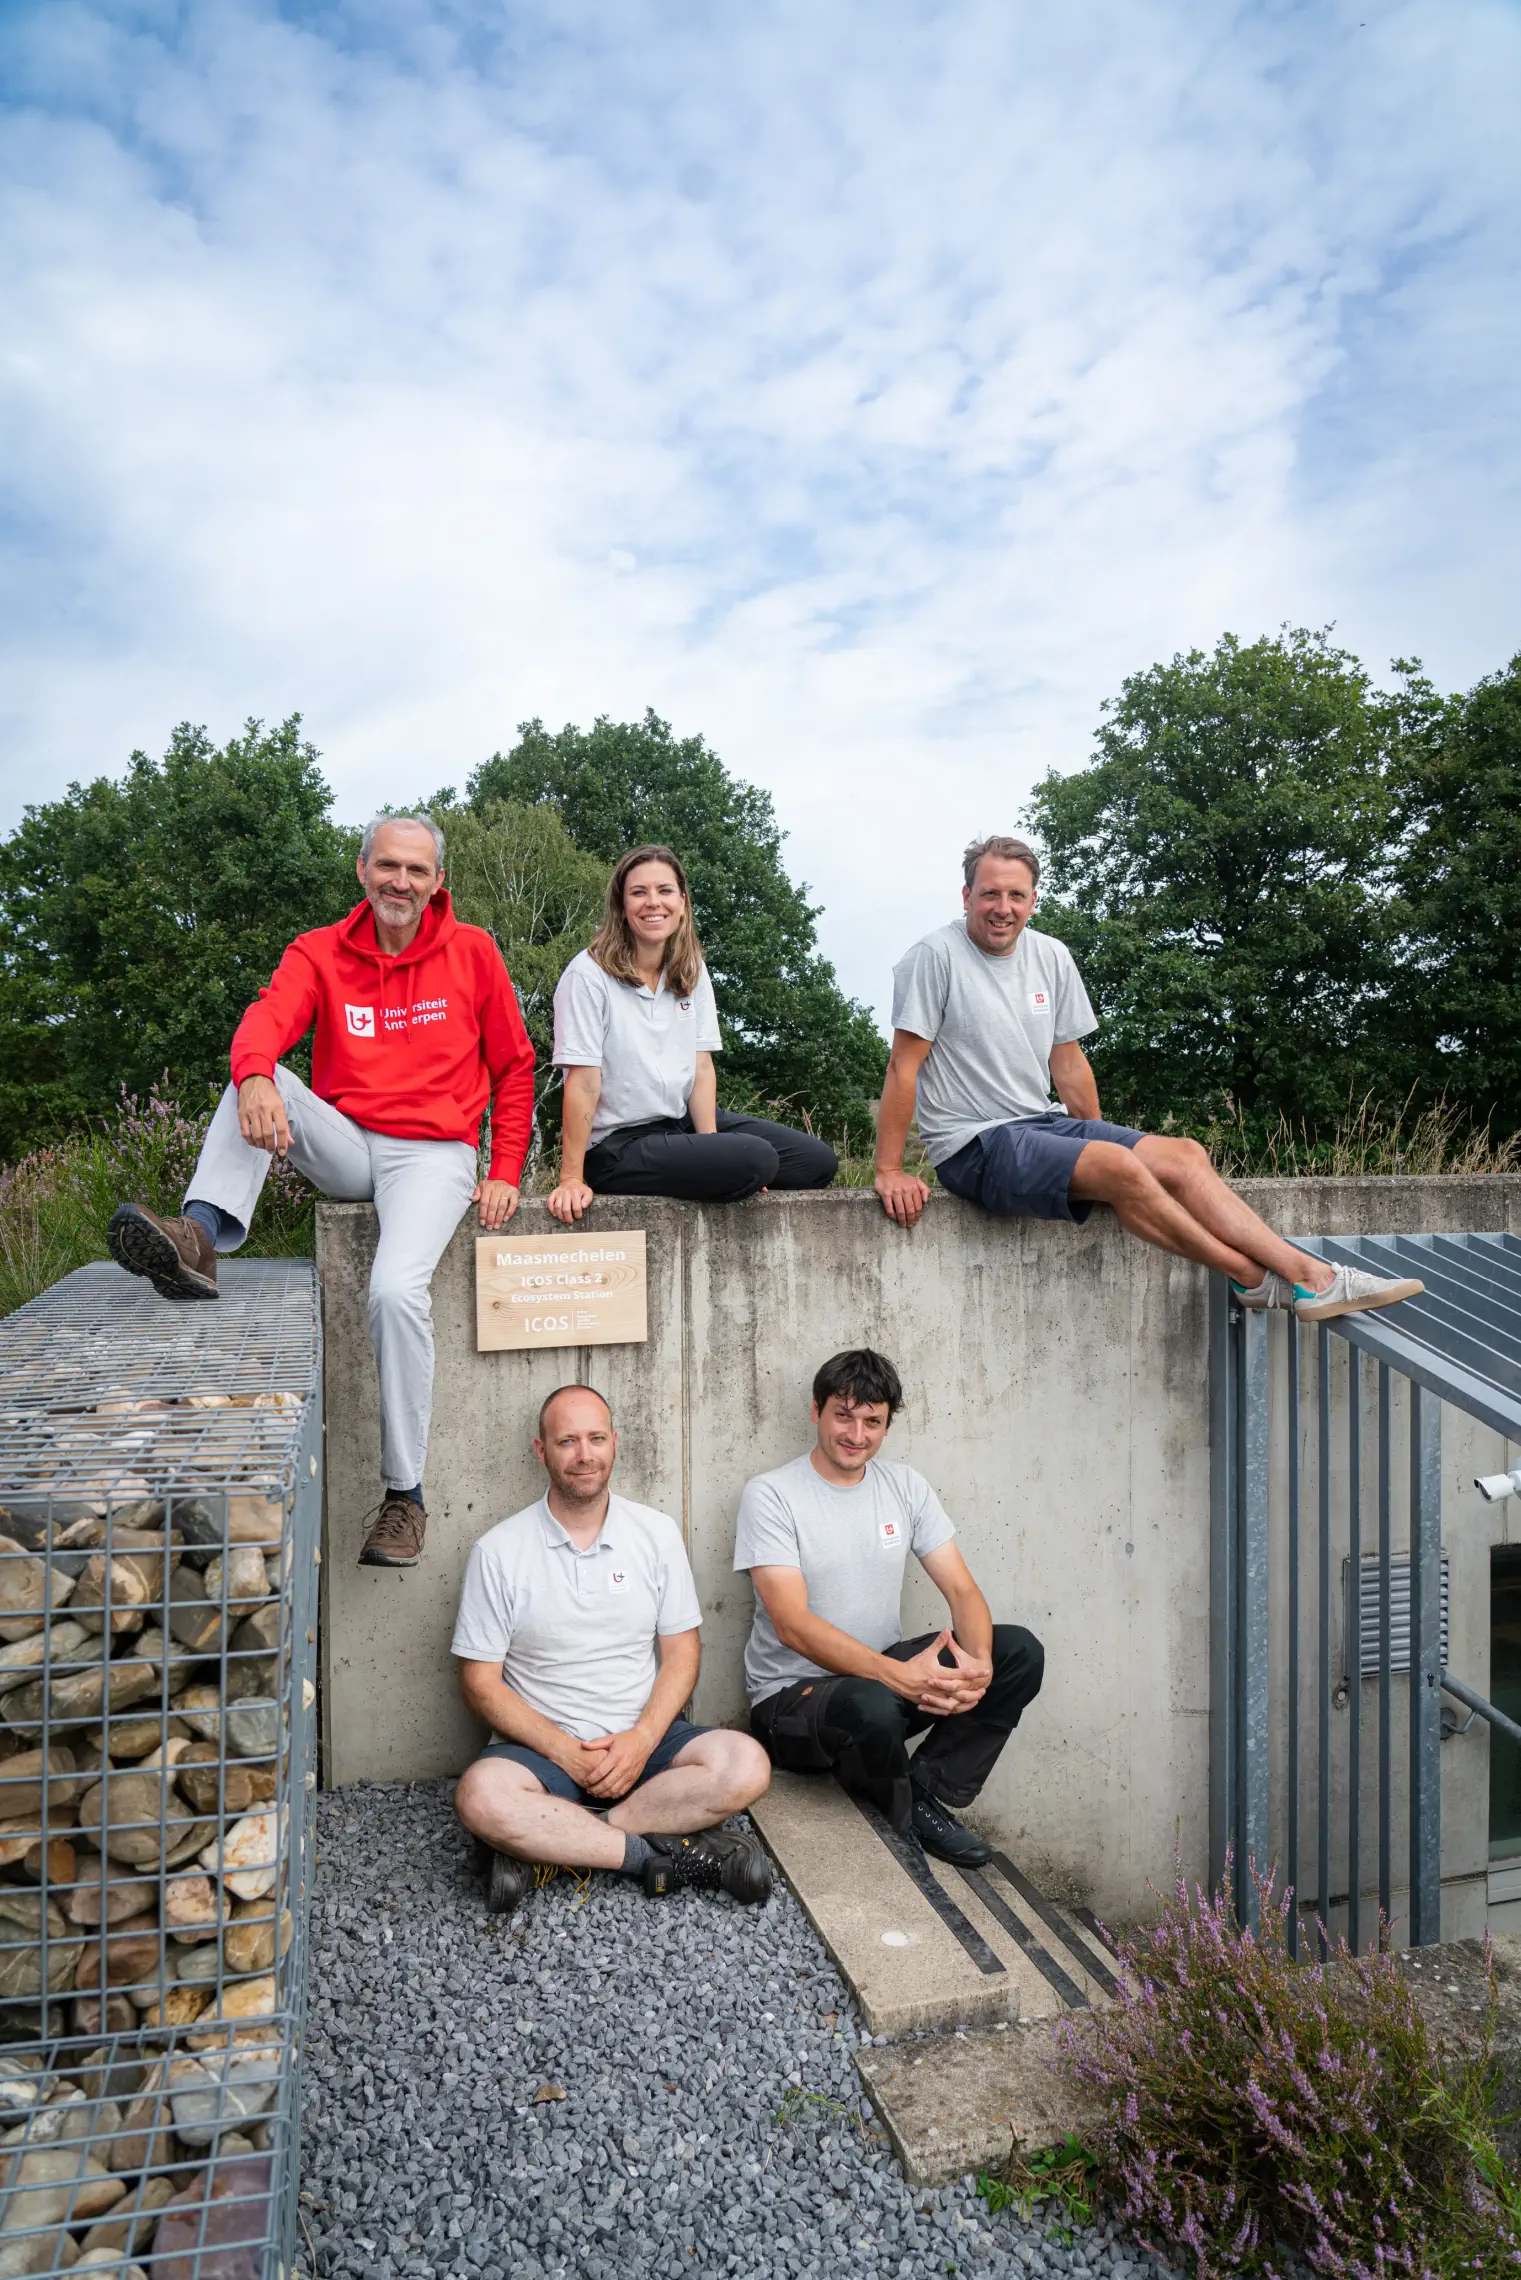
Station PI: dr. Marilyn Roland (Marilyn.Roland@uantwerpen.be)Full dataset: Maasmechelen (icos-cp.eu)
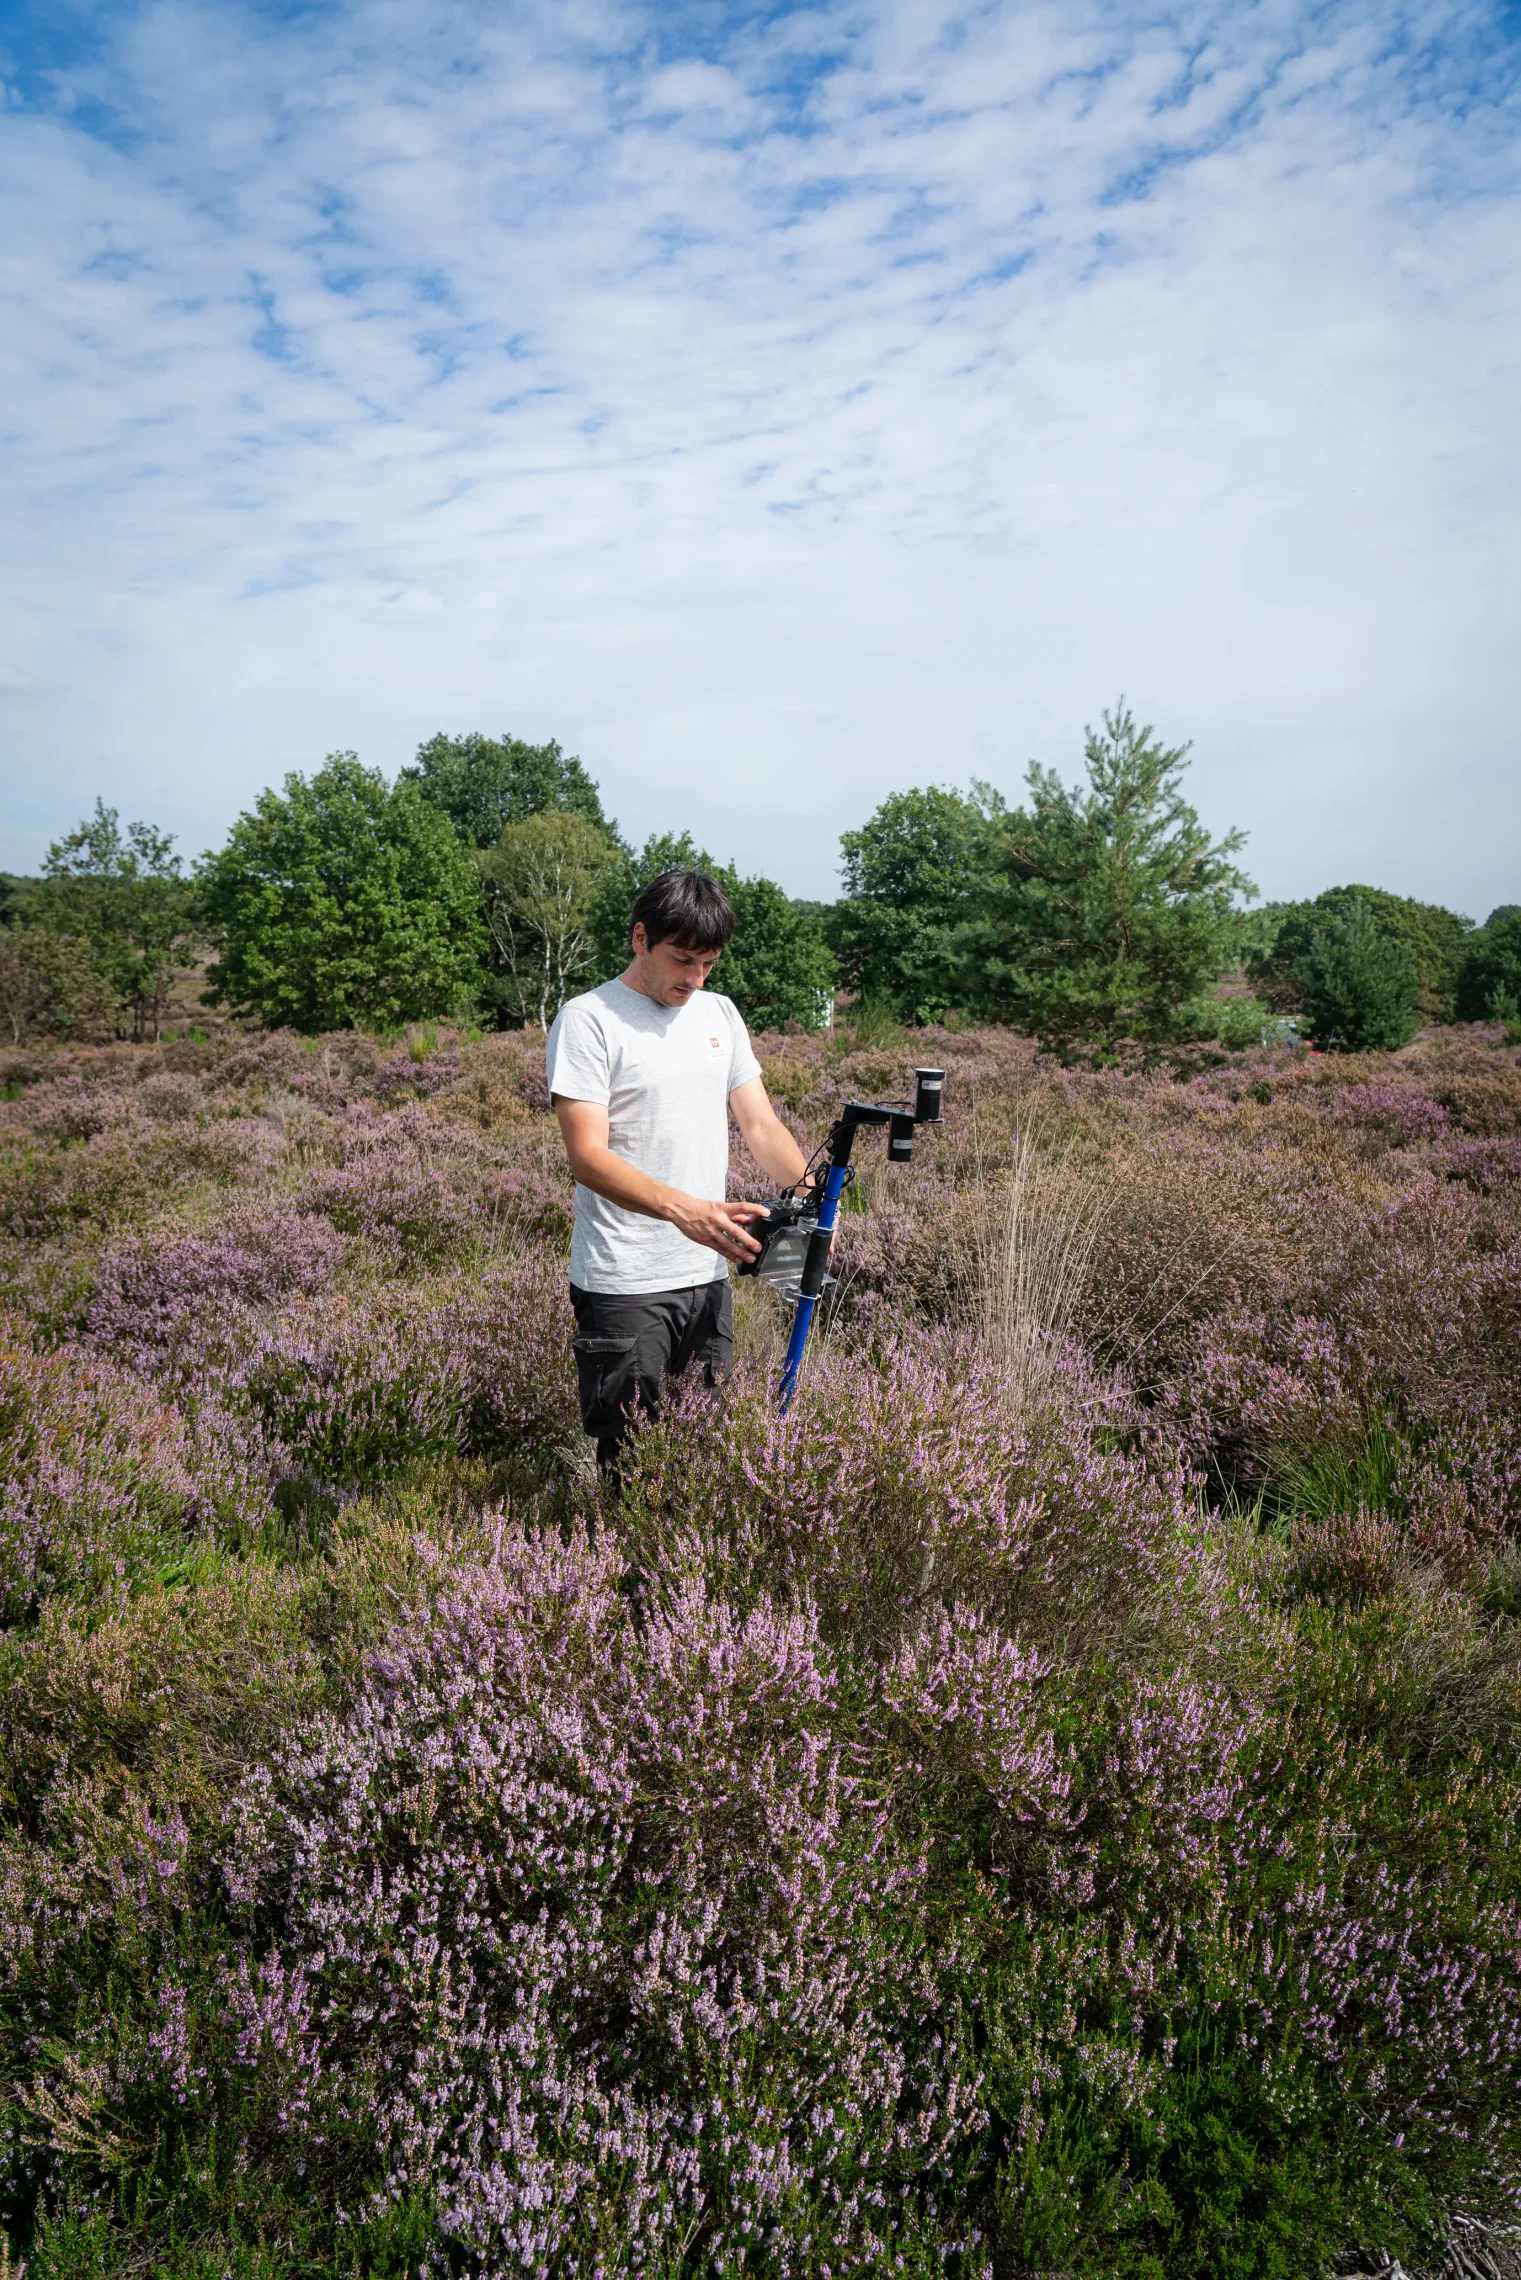
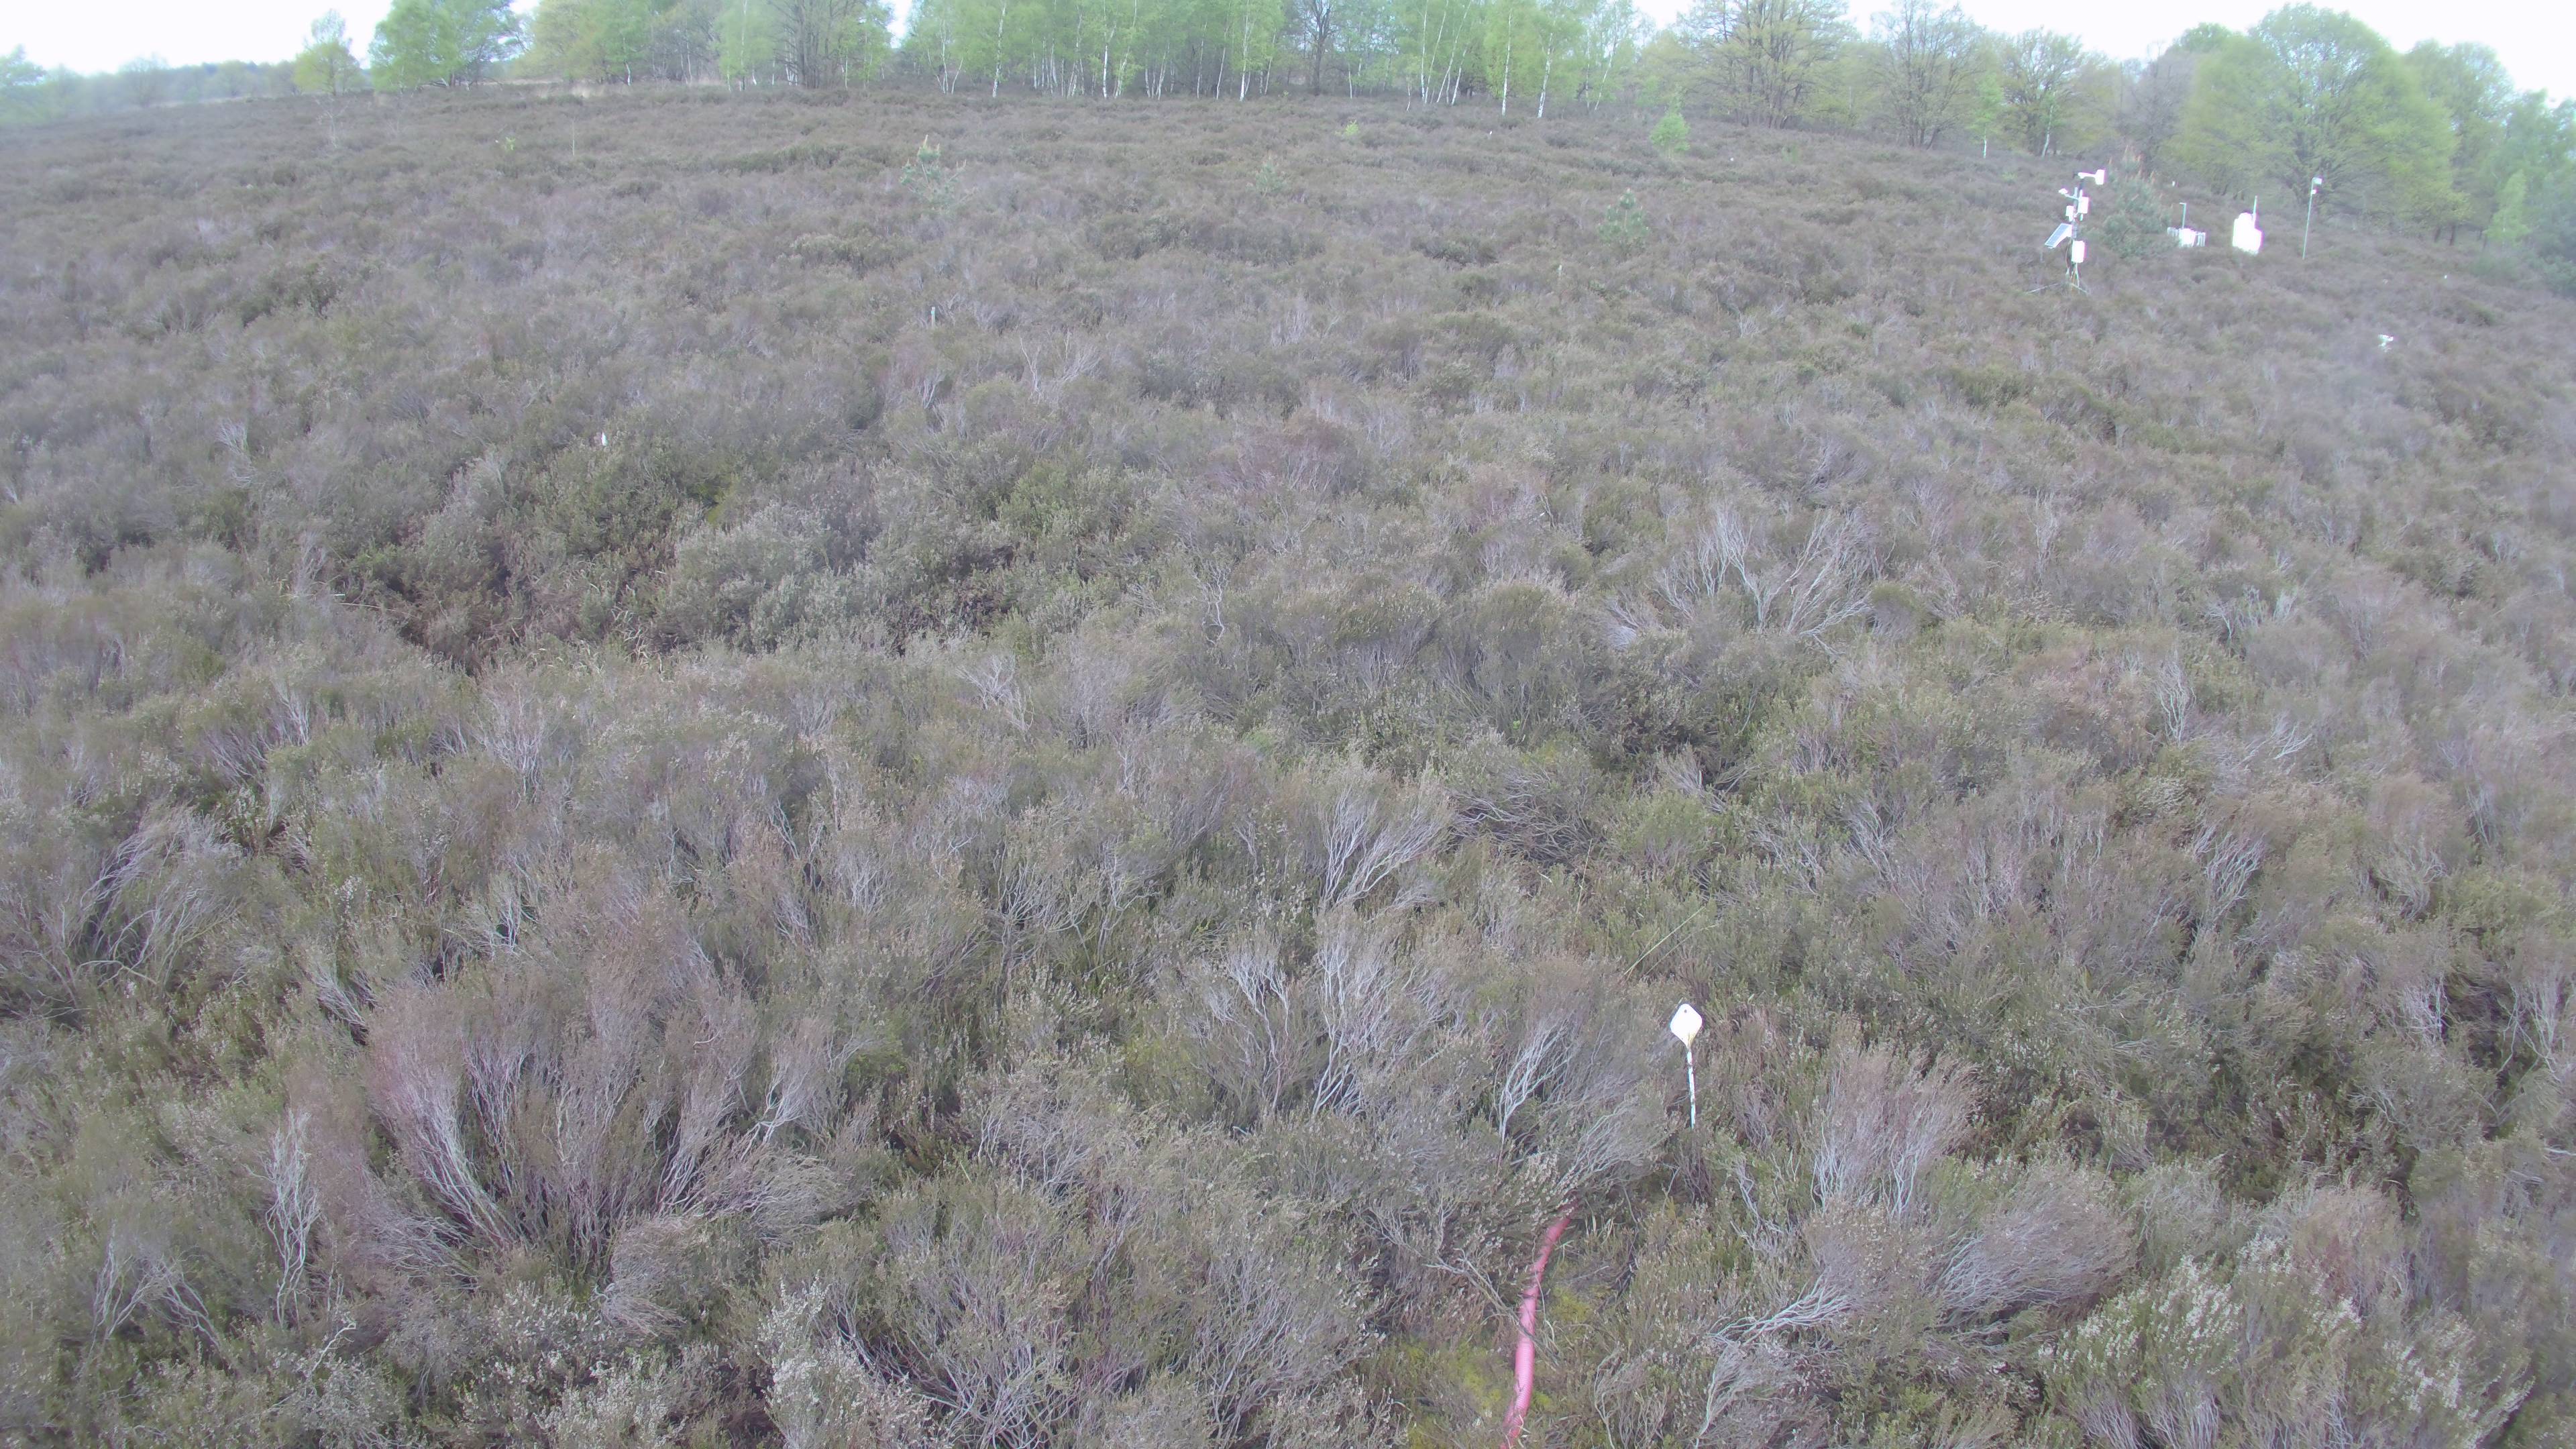 Webcam image
Station facts
- ICOS Class 2 station BE-Maa
- Located in heathland in National Park 'Hoge Kempen' on dry sandy soil
- Micromanagement to preserve heather diversity
- Coordinates: 50°58'48.7"N 5°37'53.3"E
- Flux site operational since 2016
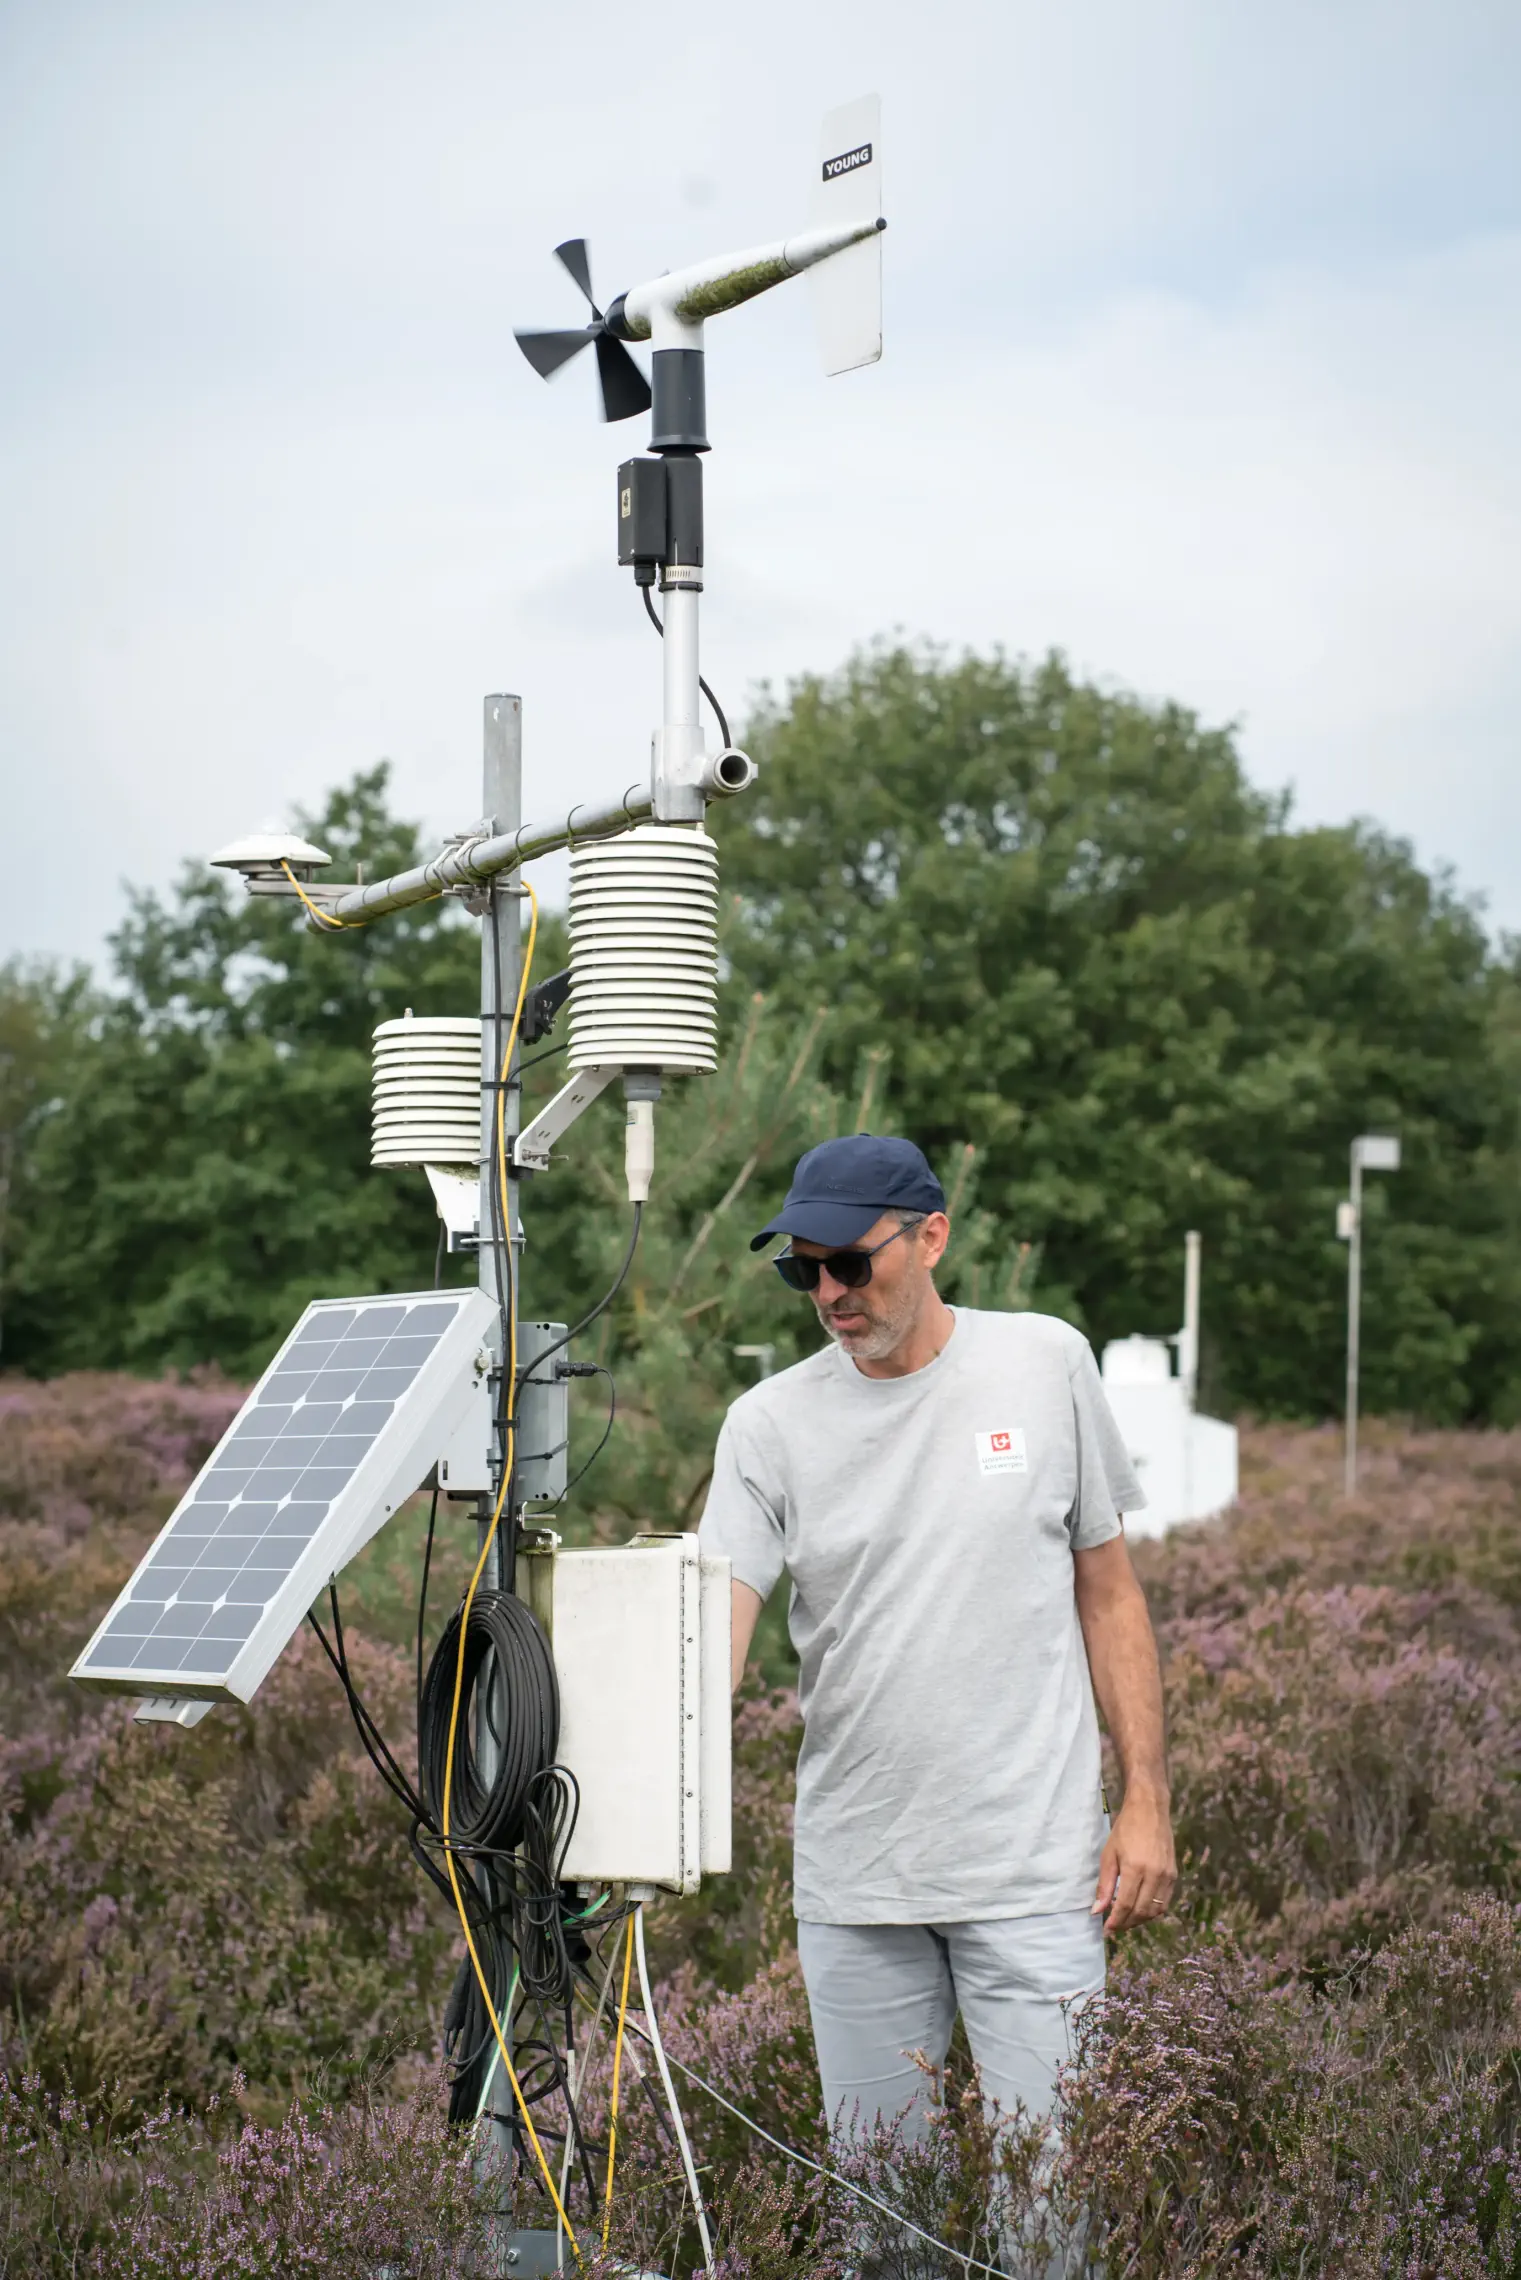
- Flux measurements conducted on 4 m high tower
- In collaboration with ANB, the ECOTRON from Hasselt University and the ANAEE research infrastructure , VMM and ISSeP
Live measurements
Water
Each bar indicates a rain shower. The higher the bar, the more intense the shower.
Carbon balance
Bars indicate the net CO2 emission or uptake. Red bars show when the shrubland emits CO2, green bars when the shrubland absorbs CO2.